Week of Nov 16, 2026: Real Rates at 2.86%, Highest Since 2008

The alarm: money is as expensive as in 2008
Real interest rates are 2.86%. That is the 10-year yield after inflation, the true price of money. A week ago it was 2.60%. The last time it was this high was November 2008, in the middle of the financial crisis (see the live answer). Today's reading sits at the 99.5th percentile of 286 months since 2003.
The 10-year Treasury yield is 5.10% on Nov 12, up from 4.84% on Nov 5. October inflation ran at 4.08% a year. Investor Ruchir Sharma calls a 5% 10-year yield the "only pin that pricks a bubble". The pin is in.
Stocks: priced like 1999 again
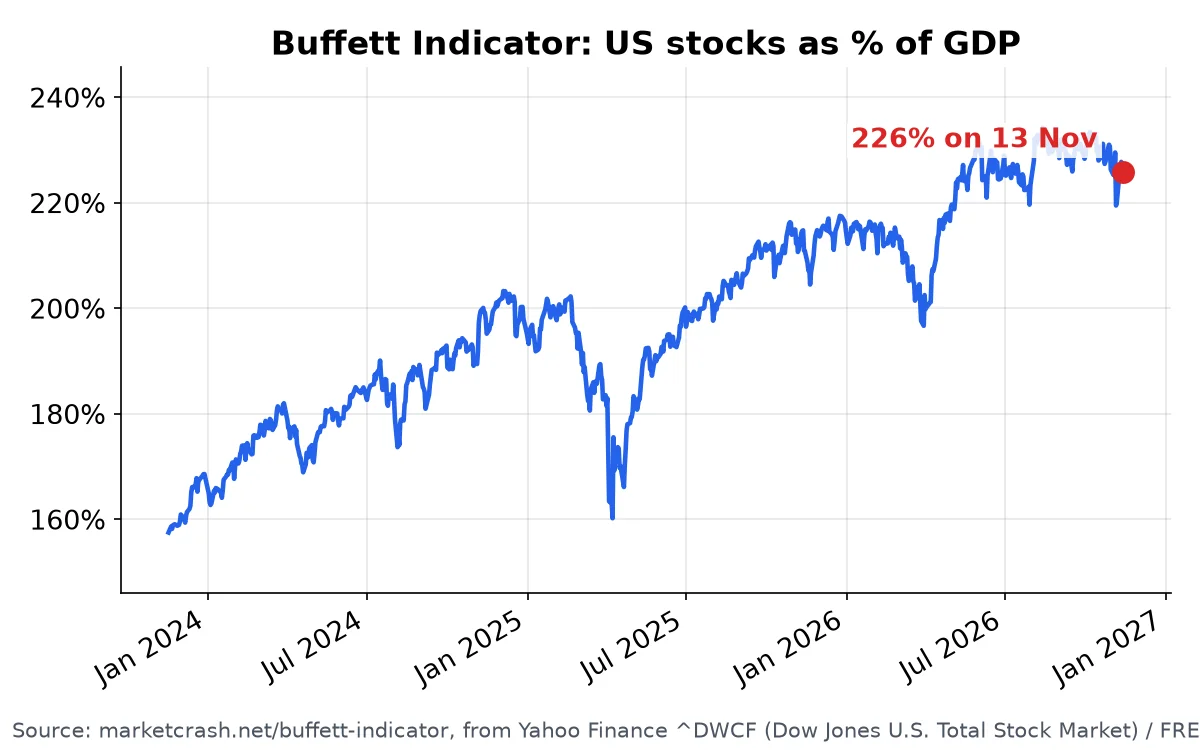
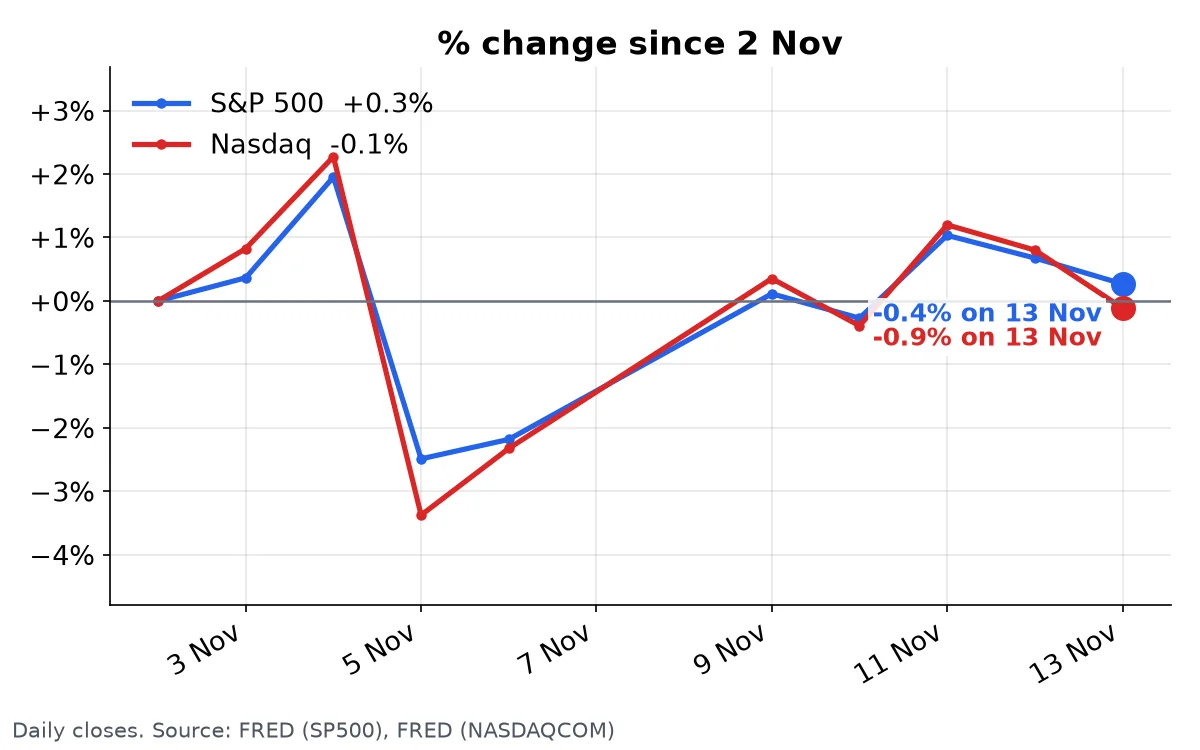
Stocks bounced, and valuations went straight back up. The Buffett Indicator is 225.8% of GDP on Nov 13, up from 220.3% on Nov 6. It sits at the 98.6th percentile of 383 months since 1995. The Shiller PE reads 40. The crash-risk score holds at 67%, with two of three warnings on.
The squeeze is plain: stocks priced like 1999, and safe bonds paying the most since 2008. Every dollar has a reason to leave stocks.
Fear eased, but it is still Extreme Fear
The Fear and Greed Index climbed to 19.9 from 1.5 a week ago. That is still Extreme Fear. The VIX fell to 18.70 on Nov 12, from 28.18 on Nov 5. Junk-bond demand scores just 11.1 of 100, and the S&P 500 still sits 0.43% below its 125-day average.
Gold broke, the dollar jumped
Gold is $3,875 on Nov 16, down from $4,114 on Nov 9. That is about 6% in a week, and 12% in 90 days. When real rates rise, gold, which pays nothing, loses its pull. The US Dollar Index jumped to 103.45 from 101.65.
Oil: Hormuz is now almost empty
The Strait of Hormuz carried 1 tanker a day in the week to Nov 8. Normal is 50.2, so traffic is down 98%. A week ago it was 1.43. Brent is $92.14 on Nov 11, up from $91.03 on Nov 9.
What to watch this week
The yield curve narrowed to 0.27% from 0.35%. At 0.2% it turns to a warning. Prediction markets put a US recession in 2027 at 26% (recession odds). Expensive stocks, the dearest money since 2008, and a closed oil route: that mix has not lasted quietly before.
Don't be the last to see it. Get the free weekly email: one email a week with the market note and the week's biggest moves. Watch the live dashboard any time.
This post describes data only. It is not investment advice.