Week of Nov 9, 2026: Fear Index Crashes to 1.5 Out of 100
The alarm: fear hit the floor
The Fear and Greed Index reads 1.5 out of 100. That is Extreme Fear, one and a half points above zero. A week ago it read 20.5, and we already called that stuck. Now it has fallen through the floor.
The index ranks each part against its own last 252 trading days. A score near zero means a reading worse than almost any day of the past year. Three of its four parts are there:
- Junk-bond demand: 0. The high-yield spread is at 3.48%, and no day of the past year scored worse.
- Safe-haven demand: 0.4. Over 20 days, stocks lagged long Treasury bonds by 10.5 points.
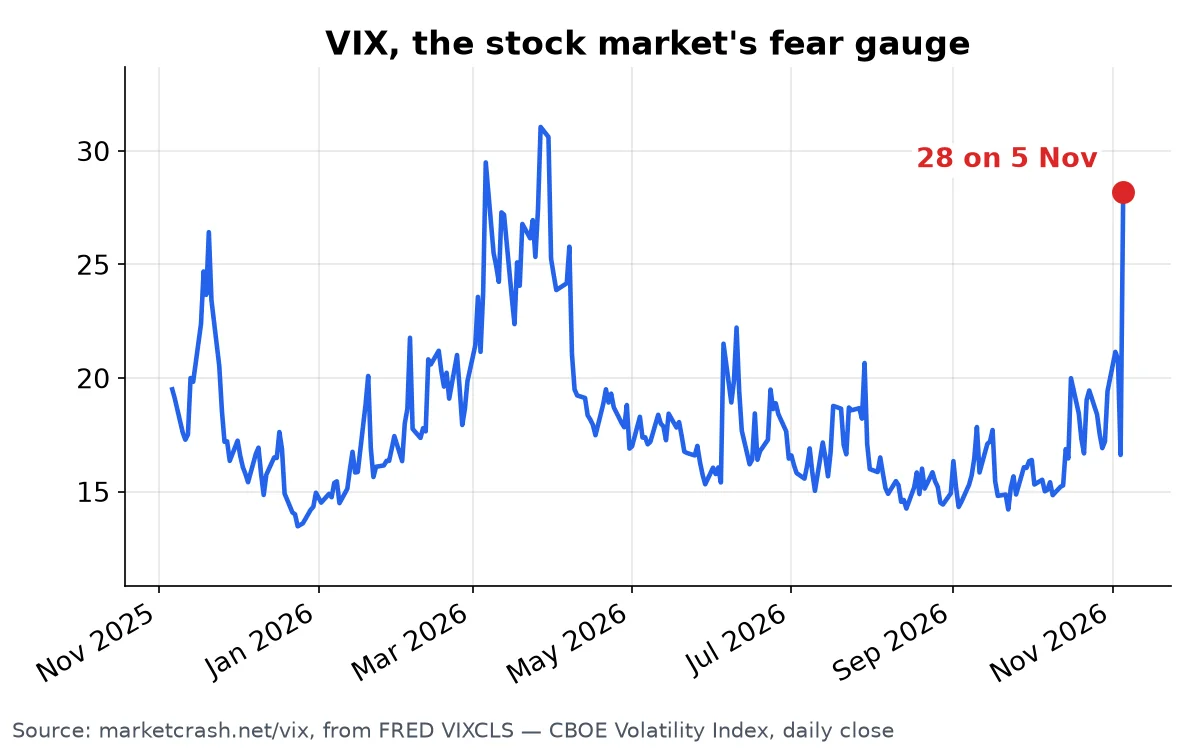
- Market volatility: 1.2. The VIX closed at 28.18 on Nov 5. On Oct 29 it was 17.20.
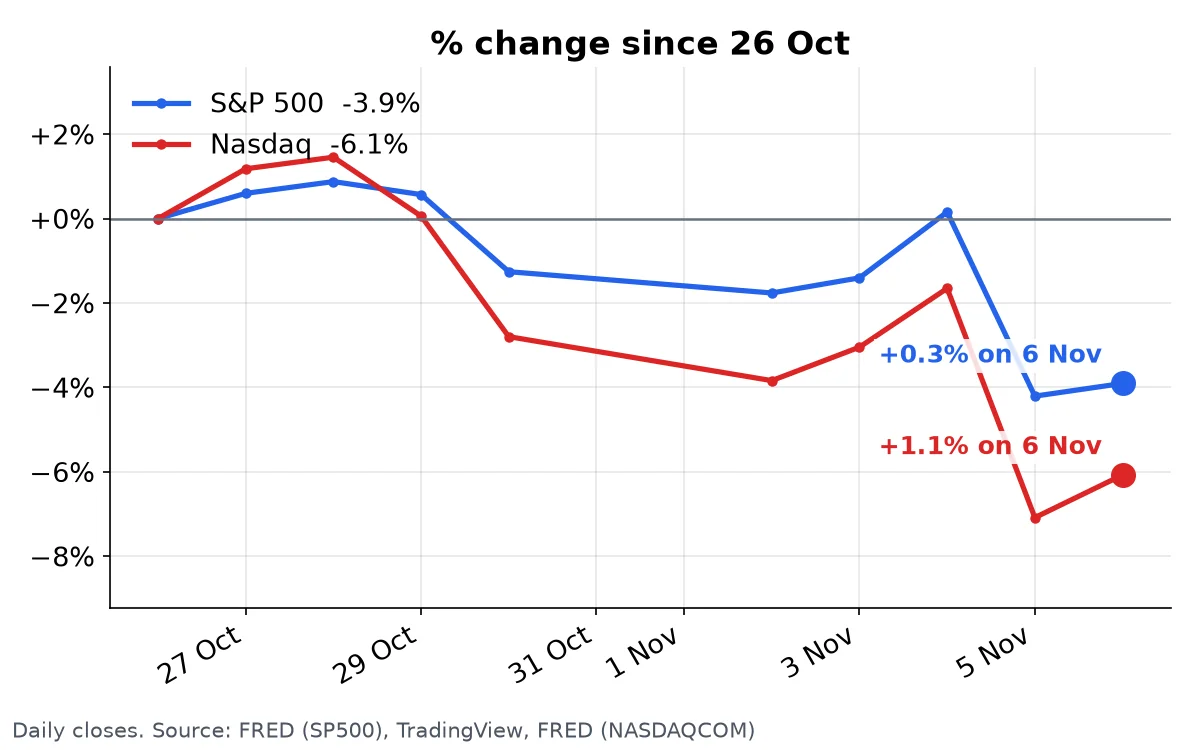
The trigger was Thursday, Nov 5, when the Nasdaq fell 5.5% in one day. The S&P 500 now sits 3.1% below its 125-day average.
Valuations: cheaper, still near 1999
The Buffett Indicator fell to 220% of GDP on Nov 6, from 231% on Oct 28. It is a big drop. It is still higher than at the 2000 peak. The Shiller PE is 38.9, down from 40.1.
The Market Analogs page still names September 1999 as the closest match, at 85.1%. All five top matches are from 1999. Back then the top came six months later, and the fall came after that.
Oil: down, but Hormuz is still shut
Brent crude was $107.03 on Nov 3, down from $123.10 on Oct 27. That looks like relief. It is not: the Strait of Hormuz carried 1.43 tankers a day in the week to Nov 1. Normal is 50.2, so traffic is down 97%. US oil cover is 41 days, down from 55 at its peak a year ago.
Gold: the hedge is back
Gold is $4,131 on Nov 9, up from $3,970 on Nov 2. That is 4% in a week, as money ran from stocks to safety.
Rates: still expensive money
The 10-year Treasury yield fell to 4.84% on Nov 5, from 4.98% on Oct 29. Real rates are 2.60%. The 30-year mortgage rate is 7.18%. The crash-risk score holds at 67%, with two of three warnings on.
What to watch this week
The stock market is near 1999 prices. The bond market and the options market are flashing at their worst level of the year. Oil's biggest route is still nearly empty. Fear this deep can mean the worst is priced in, or it can be the first act. History has examples of both.
Don't find out last. Get the free weekly email with every reading that moves, and watch the live dashboard any time.
This post describes data only. It is not investment advice.