Is This the Start of a Crash? The Nasdaq Just Fell 5.5% in One Day

The move
On Thursday, Nov 5, the Nasdaq fell 5.52% to 24,315 and entered correction territory. The S&P 500 lost 4.36% to 7,353.73, its worst day since April 2025. The Dow dropped about 1,830 points. Chip stocks led the fall: the Philadelphia chip index lost about 12% as the AI trade came apart after the midterm election. The VIX jumped about 70%, to roughly 28.
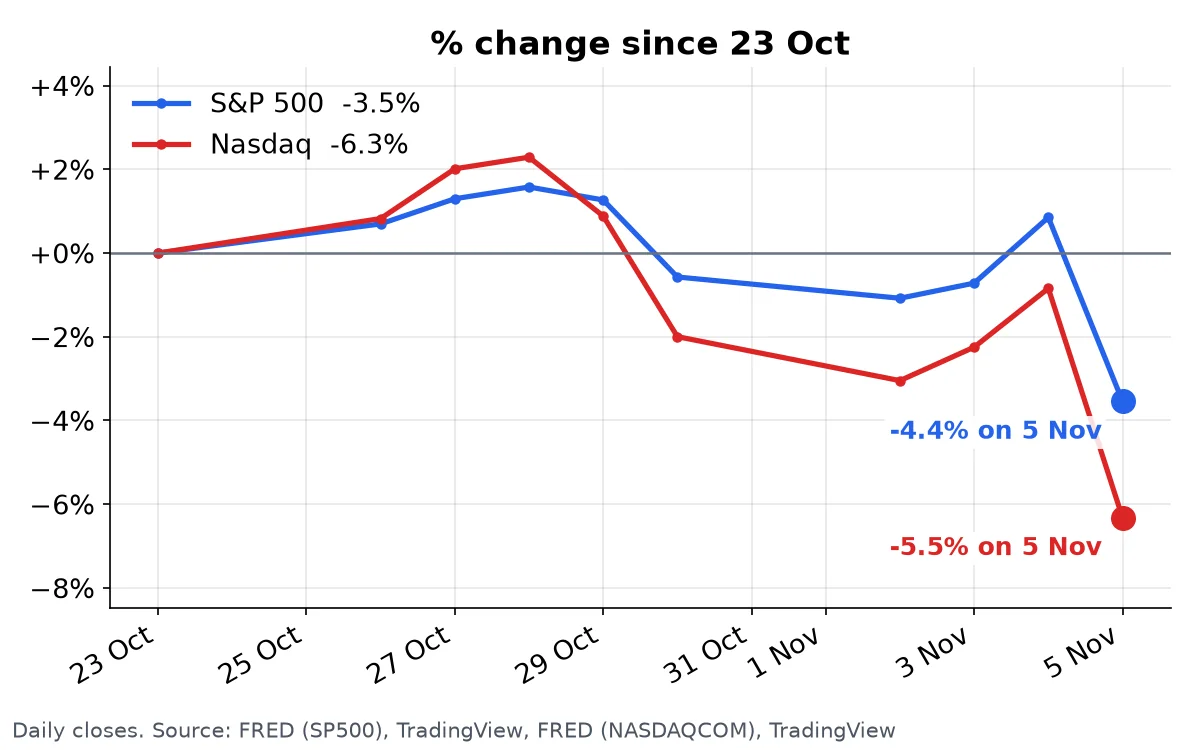
One terrible day is not a crash. The question is whether the market was ready to fall. The readings on this site say it was.
What the numbers say
Crash-risk score: 67.0%. Two of three crash warnings are on, and they were on before Thursday.
Buffett Indicator: 219.5% of GDP, down from 230.6% on Oct 29. Even after the drop, it sits at the 98th percentile of every month since 1995. Before the 2000 crash it was 146%.
Shiller PE: 38.8, down from 40.6 in October. Stocks got cheaper this week. They are still priced near the dot-com top.
Fear and Greed Index: 19.5, Extreme Fear. Junk-bond demand scores 3.2 out of 100. The bond market was scared long before stocks broke.
The closest past case
The Market Analogs page ranks every month since 1976 against today. The closest match is September 1999, an 85.1% match with a Shiller PE of 41.3. All five top matches come from 1999.
Here is the uncomfortable part. After September 1999 the S&P 500 still rose 12% in a year. The top came in March 2000. Then the Nasdaq lost most of its value. The setup that looks like today was not the crash itself. It was the last stretch before it.
Is Thursday the start? Nobody knows. But the market is priced like 1999, and now it is falling like it means it.
This post describes data only. It is not investment advice.
Don't find out from the headlines. Get the week's biggest moves by email, at most once a week and only when something moved: subscribe on the MarketCrash dashboard.