Week of Nov 2, 2026: Fear Stuck at 20.5 After the Nasdaq's Worst Day Since June
The alarm: fear will not let go
The Fear and Greed Index reads 20.5, Extreme Fear. A week ago it read 21.6. Two weeks ago it was still in the 30s. The panic did not fade. It settled in.
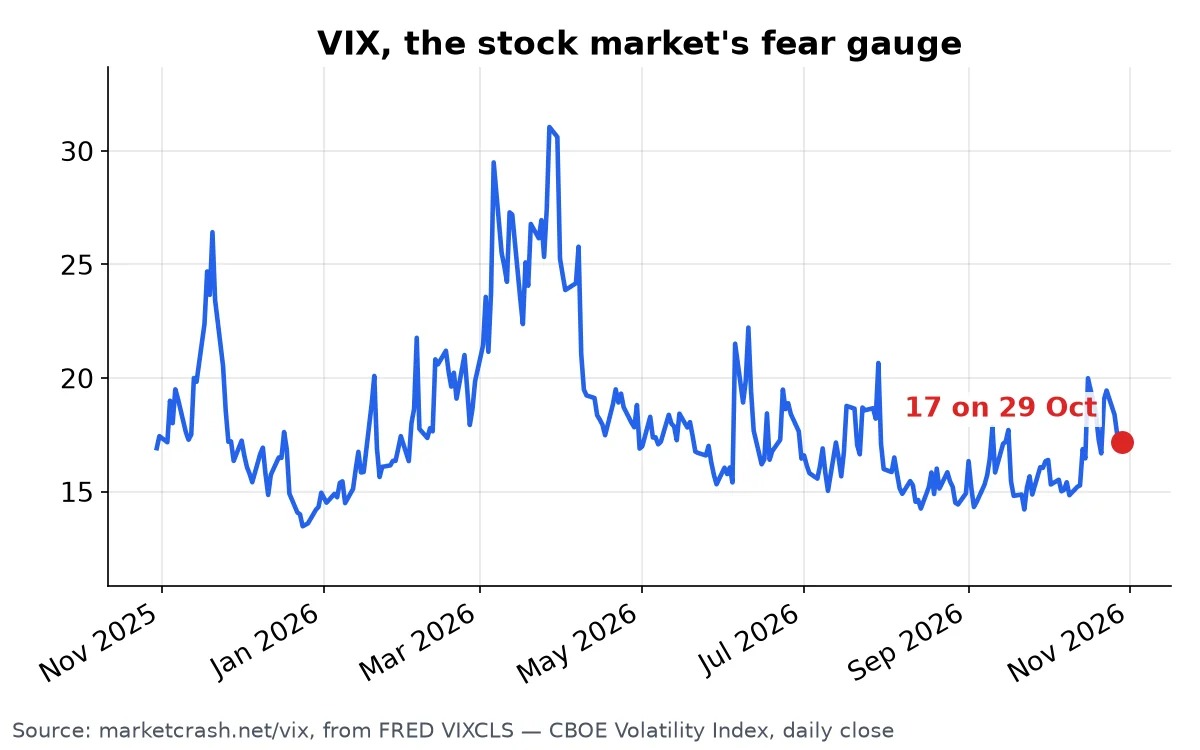
The trigger came on Friday, Oct 30. The Nasdaq fell 2.86% to 25,437, and the S&P 500 lost 1.82% to 7,580. It was the worst day since June for both, and the second Nasdaq drop of more than 2.5% in eight trading days. The chip sell-off was led by Intel, and fears about AI cash burn are back.
Look inside the index. Junk-bond demand scores 5.2 out of 100. Safe-haven demand scores 9.1. Big money is quietly leaving risk and buying safety. That usually happens before the crowd notices, not after.
Oil: Brent jumped almost $8 in a week
Brent crude was $123.10 on Oct 27, up from $115.22 on Oct 20. On Oct 23 it touched $128.30. It is up 34% in three months.
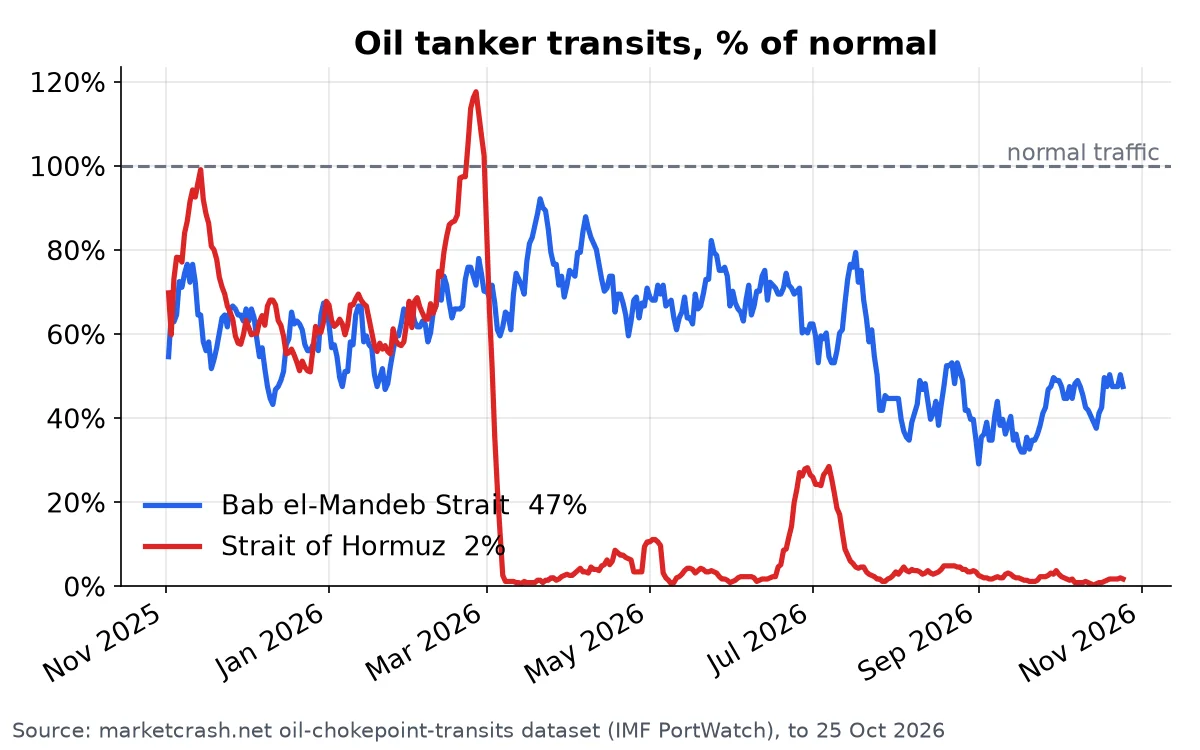
The reason has not changed. The Strait of Hormuz carried 0.86 tankers a day in the week to Oct 25. Normal is 50.2. That is −98.3%. The Bab el-Mandeb is at 9.6 a day against a normal 20.2. US oil cover, commercial stocks plus the reserve, is 42 days, down from 55 a year ago.
Gold and silver: even the safe metals fell
Gold closed at $3,923 on Nov 2, down from $4,038 on Oct 26, a 3% drop in a week. Silver fell from $54.11 to $50.52, almost 7%. When even the hedges fall, investors are selling what they can, not what they want to.
Rates: the 10-year still near 5%
The 10-year Treasury yield was 4.98% on Oct 29, after 5.05% the day before. The 30-year mortgage rate is 7.24%. Real rates stand at 2.63%, flat on the week. Money is expensive, and it is not getting cheaper.
Valuations: still priced like 1999
The Buffett Indicator reads 226% of GDP, from 227% a week ago. The Shiller PE is 40.1. The crash-risk score is unchanged at 67%, with two of three warnings on.
The Market Analogs page still names September 1999 as the closest match, at 85.1%. Back then the market kept rising for six more months. Then the Nasdaq lost most of its value. Nobody rang a bell at the top.
What to watch this week
Two hard falls in eight days. Fear stuck at 20. Oil above $120 with Hormuz almost empty. Valuations next to the 2000 peak. Each one alone is a warning. Together they are the picture that comes before big moves.
Don't find out last. Get the free weekly email with every reading that moves, and check the live dashboard any time.
This post describes data only. It is not investment advice.