Is This the Start of a Crash? The Nasdaq Just Fell 2.9% in One Day

The move
On Friday, Oct 30, the Nasdaq fell 2.86% to 25,437.00. The S&P 500 lost 1.82% to 7,580.07. It was the worst day since June for both. Intel dropped nearly 29% after weak guidance, and chip stocks fell more than 7% as fear about AI spending came back. The VIX jumped from 17.20 to 19.42.
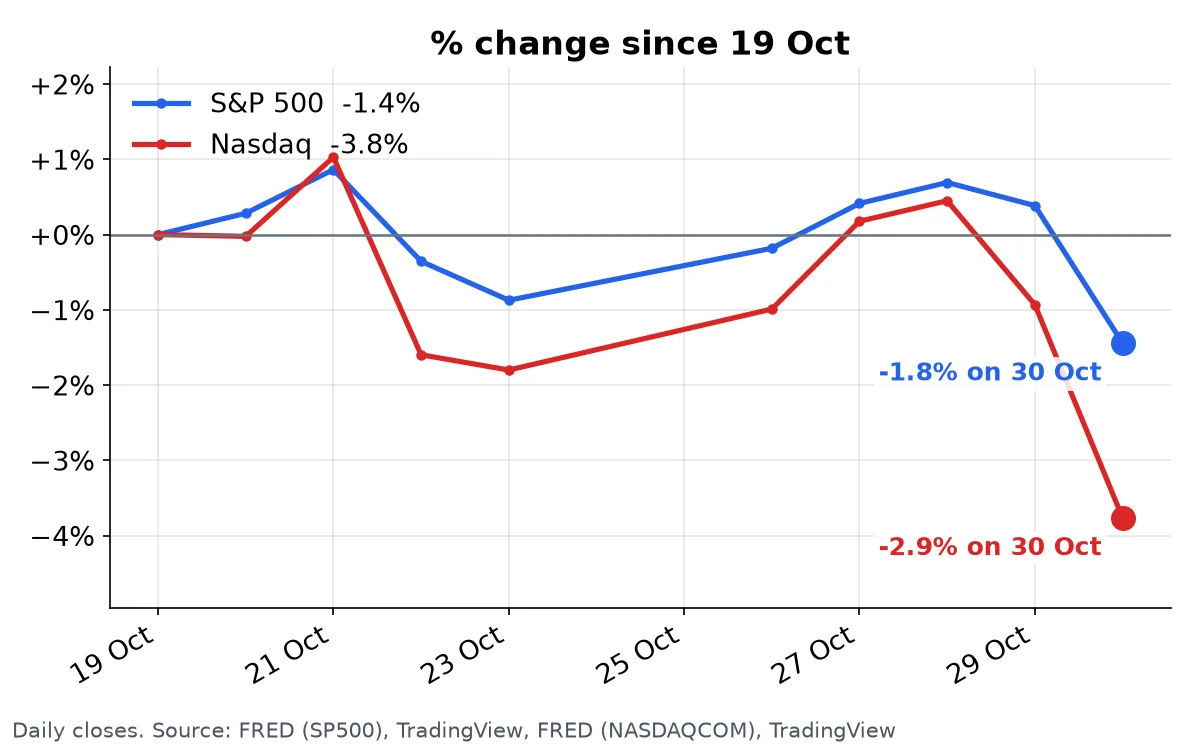
This is the second Nasdaq drop of more than 2.5% in eight trading days. On Oct 22 it fell 2.6%.
One bad day is not a crash. The question is whether the market was ready to fall. Three readings on this site say it was.
What the numbers say
Crash-risk score: 67.0%. Two of three crash warnings are on. The Buffett Indicator reads 226% of GDP, and the Shiller PE sits at 40.
Fear and Greed Index: 20.5, Extreme Fear. A week ago it was 30.4. Junk-bond demand scores 5.2 out of 100 and safe-haven demand 9.1. Money is running to safety.
The closest past case
The Market Analogs page ranks every month since 1976 against today. The closest match is September 1999, an 85.1% match, with a Shiller PE of 41.3. All five top matches come from 1999.
After September 1999 the S&P 500 still rose 12% in a year. The top came in March 2000. Then the Nasdaq lost most of its value. The setup that looks like today was not the crash itself. It was the last stretch before it.
Is Friday the start? Nobody knows. But two hard falls in eight days, Extreme Fear, and a market priced like 1999 is not a calm picture.
This post describes data only. It is not investment advice.
Don't find out from the headlines. Get the week's biggest moves by email, at most once a week and only when something moved: subscribe on the MarketCrash dashboard.