Week of Oct 26, 2026: Fear Index Crashes to 21.6, Extreme Fear in Three of Four Gauges

The alarm: fear turned into panic
Two weeks ago the Fear and Greed Index read 52.5, Neutral. A week ago it read 31.6, Fear. Today it reads 21.6, Extreme Fear. In fourteen days the market went from calm to panic.
Three of its four parts now sit at Extreme Fear. The worst is junk-bond demand: it scores 0.8 out of 100, down from 3.6 a week ago. That means the price of lending to weak companies is near its worst level of the past year. The high-yield spread is 3.40 points over Treasuries (Oct 22). When credit breaks first, stocks usually follow.
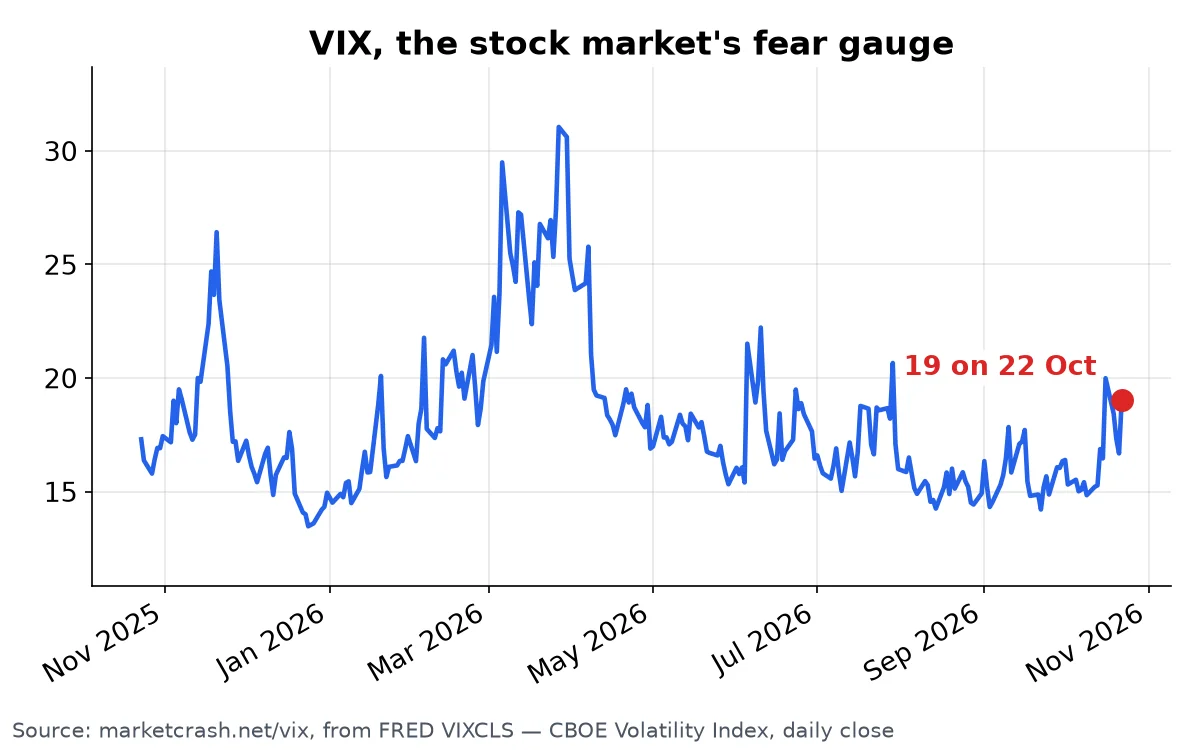
The VIX, the fear gauge, closed at 19.03 on Oct 22, up from 16.46 a week ago and up 2.35 in a single day.
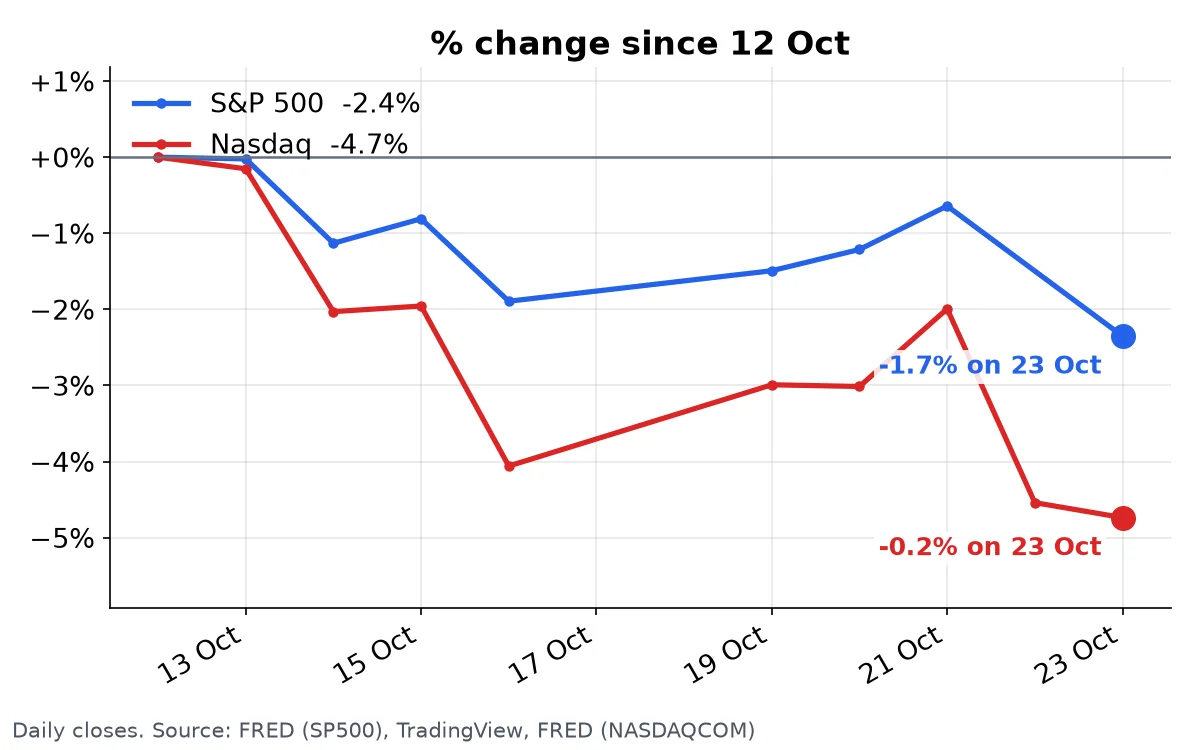
The other big moves
Private Credit: ELEVATED. The six largest listed lending funds trade at a median 11.8% below the value of their own loans. 5 of 6 are under water. The deepest, FS KKR Capital, trades 43.0% below its stated loan value: the market believes less than 60 cents of each dollar it reports.
Strait of Hormuz: still shut. Tanker traffic is 0.57 a day (Oct 18) against a normal 50.2. That is 98.9% below normal, the same as a week ago. The Bab el-Mandeb eased to 10.0 a day, 50.4% below normal (57.5% last week). Brent fell to $115.22 (Oct 20) from $126.55, but is still +22.4% in three months. A cheaper barrel does not reopen a strait.
Shiller PE: 40, down from 41. It is still the 98.7th percentile since 1871. The only higher peak was before the dot-com crash. The Buffett Indicator is 230%, down from 231.1%. Before the 2000 crash it was 146%.
Yield curve: 0.31%, down from 0.35%. It is the last crash signal still positive, and it slips every week.
Debt Spiral: CRITICAL. Interest eats 16.50% of federal spending. The 10-year yield eased to 4.96% (Oct 22) from 5.10%, and the 30-year to 5.29% from 5.43%. Japan still holds $1.07tn of US debt, 9.77% less than a year ago.
The crash-risk score holds at 67.0%, with two of three warnings on.
A crash needs a market expensive enough to fall and a trigger. The market is still priced near 1999. The trigger is still on the board. And this week the crowd stopped being calm.
This post describes data only. It is not investment advice.
Don't find out from the headlines. Get the week's biggest moves by email, at most once a week and only when something moved: subscribe on the MarketCrash dashboard.