MarketCrash Weekly Recap: Oil Chokepoints Lead, Crash Risk and Growth Both at 67% (week to 12 Oct 2026)
The week in one line
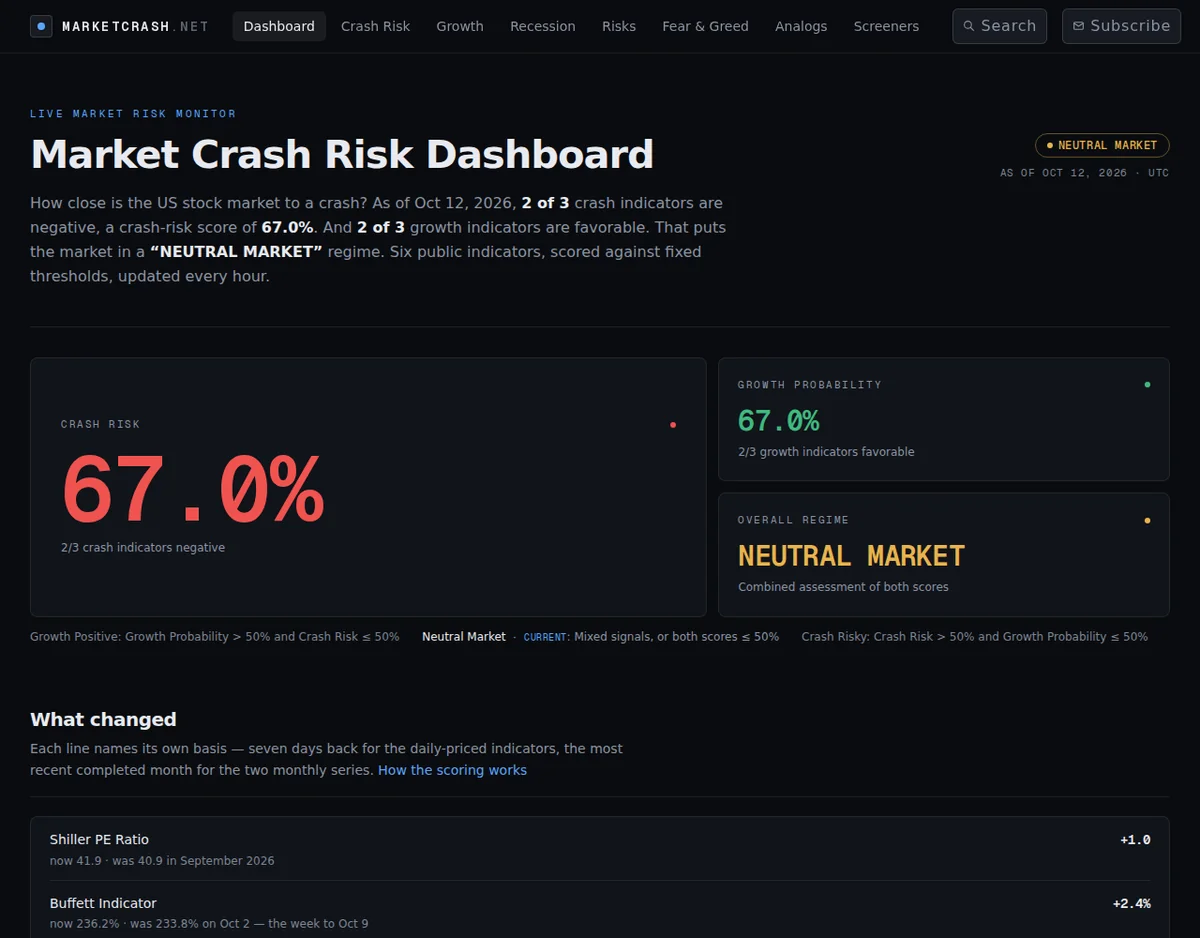
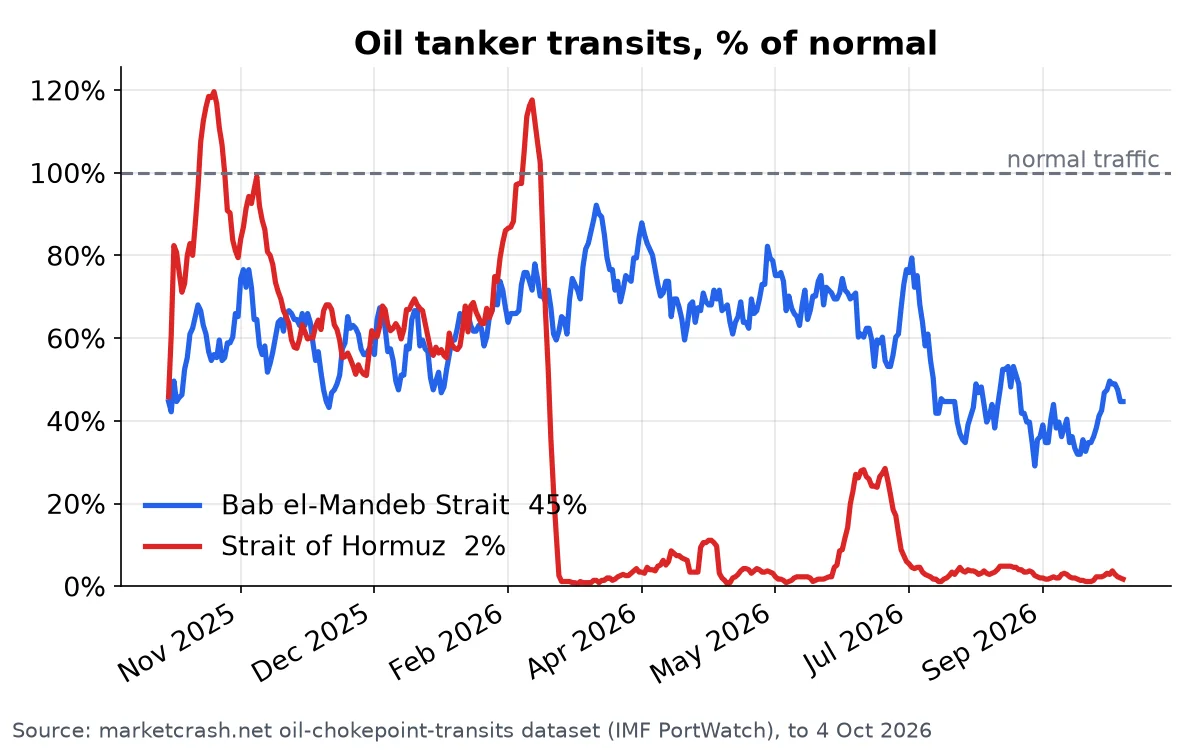
The biggest story in the data is still oil. Tanker traffic through the two main Middle East chokepoints is far below normal, and Brent crude is up sharply over three months. The two headline scores did not change: crash risk and growth probability both read 67%, and the dashboard calls the overall regime a neutral market.
Biggest moves: oil chokepoints
- Strait of Hormuz transits: 0.86 tankers a day (7-day mean) as of 4 Oct, against a pre-disruption baseline of 50.2. That is 98.3% below baseline, and the page labels it severe disruption. The latest reading is down 0.14 (14%) from the one before it.
- Bab el-Mandeb transits: 9.0 tankers a day as of 4 Oct, against a baseline of 20.1. That is 55.3% below normal, also labeled severe disruption. The page notes that ships avoiding the strait can go around Africa instead, which adds 10 to 14 days to each voyage.
- Brent crude: $125.44 a barrel as of 6 Oct. It is up $48.94 (+64.0%) over three months and down $0.07 from the reading before.
The oil shock page gives the combined chokepoint picture a critical rating, driven by Hormuz. It also shows US oil days of cover at 42.9 days for the week of 2 Oct, down from a peak of 55.0 days in October 2025.
Crash-risk score: 67%, two of three negative
The crash-risk score is 67%, labeled high risk. It is built from three indicators:
- Buffett Indicator: 236% as of 9 Oct, up 1 point from the previous reading and up 5.70 pp over three months. That puts it in the 99.9th percentile of months since 1995, well above the page's 150% negative threshold. Negative.
- Shiller PE ratio: 42 as of 9 Oct, up 1 from the previous reading and up 1.85 over three months. The page puts the long-run average at about 16–17. Negative.
- Yield curve (10Y–2Y): 0.44% as of 9 Oct, down 0.03 pp from the previous reading but up 0.09 pp over three months. That is still above the 0.2% warning line. Positive.
Growth score: 67%, two of three favorable
The growth probability is 67%, labeled high growth:
- US money supply (M2): $23.3T as of 1 Aug, up $124.9B (+0.54%) from the previous reading and up $329.1B (+1.43%) over three months. Positive.
- Real interest rates: The 10-year TIPS yield was 2.87% on 8 Oct, down 0.05 pp from the previous reading. That is the 98.6th percentile of months since 2003. Positive.
- US Dollar Index (DXY): 102.21 as of 9 Oct, up 0.07 on the day and up 1.24 (+1.23%) over three months. A three-month rise of more than 1% makes it negative.
Data notes
The data changelog has no new entries this week. The latest corrections are still the ones from 25 July, to real interest rates and the Buffett Indicator.
See every live number on the dashboard at marketcrash.net.