MarketCrash vs Multpl: A Crash Verdict vs a Table of Ratios
You have the ratio. Now what?
You've done this before. The market feels high, so you open Multpl and look up the Shiller PE. It reads 41.87 as of Fri Oct 9, against a mean of 17.42. Your stomach drops, and then you're stuck.
Is that number enough to act on? What is the yield curve doing? Does the Buffett Indicator agree? Is something outside the stock market about to break, like oil, Treasuries or private credit? Soon you have a pile of tabs open, and your view of the market is pieced together from all of them.
That is the gap between a data site and a crash monitor.
What Multpl does well
Multpl describes itself as "Market, financial, and economic data." Its homepage lists series such as the Shiller PE Ratio, the 10 Year Treasury Rate, the US Inflation Rate and the US GDP Growth Rate. Its Shiller PE history reaches back to Dec 1920, with "Data courtesy of Robert Shiller from his book, Irrational Exuberance."
We think highly of that history. MarketCrash takes its own Shiller PE history from Multpl. If you want a long-run valuation series and plan to read it yourself, Multpl is a clean place to get it.
The limit is what you don't get. Neither the homepage nor the Shiller PE page offers a composite score, alerts, screeners or an email signup. You get the numbers, and putting them together is your job.
The after-state: one screen, one verdict
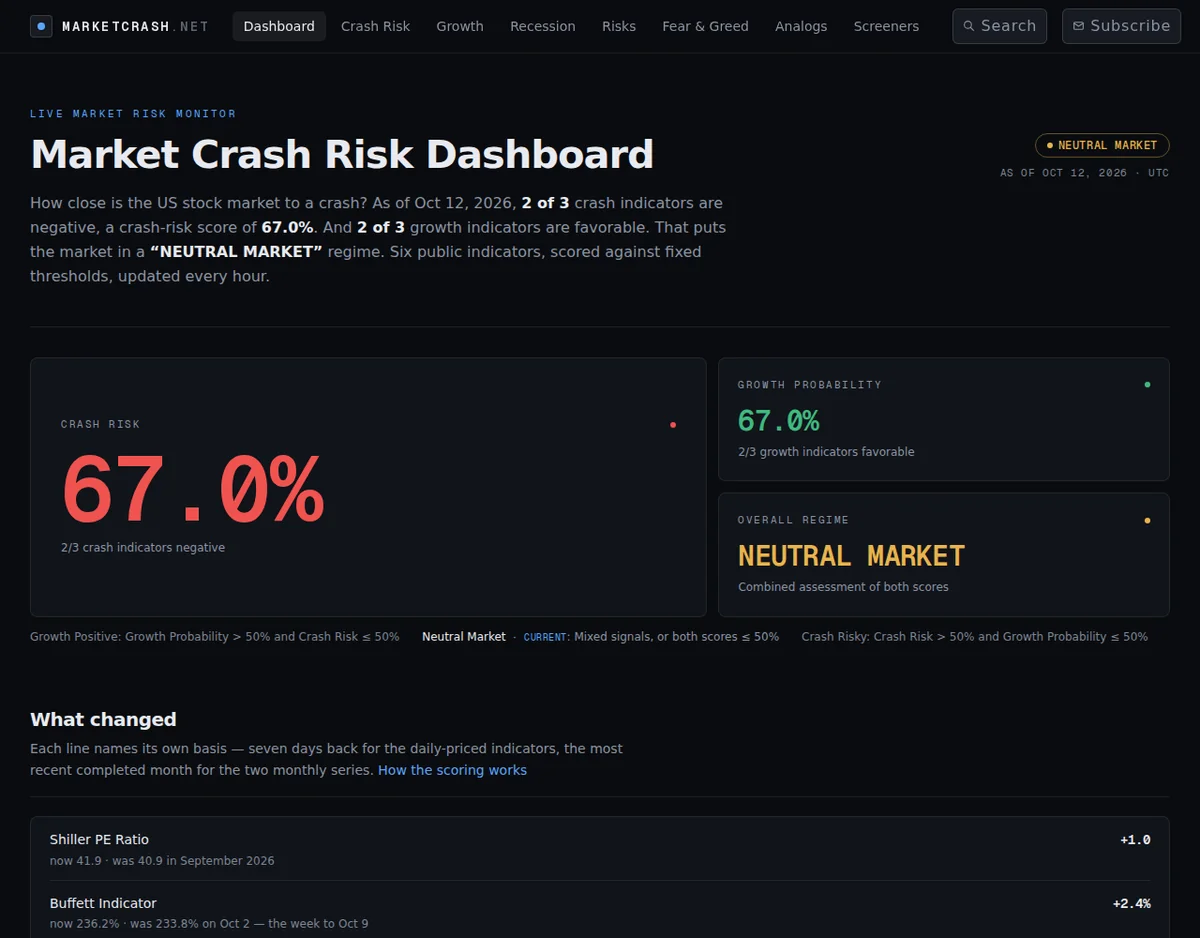
Open MarketCrash and that work is already done. The Buffett Indicator, the 10Y-2Y yield curve and the Shiller PE (CAPE) feed a single Crash Risk score. A separate Growth score tracks the US Dollar Index, M2 money supply and real interest rates. Together they set an overall market regime. Each signal is color-coded, so you can see which ones are flashing and which are calm without opening another tab. If you want to know what moved, the "What changed" section sits right under the scores.
Then it does something a ratio table can't: it watches risks that never show up in a P/E.
Risks a ratio table won't show you
The MarketCrash dashboard runs risk monitors for Oil Shock, AI Debt, Private Credit, Treasury Dump and Debt Spiral. Here's why that matters. Our latest weekly blog covered Hormuz tanker traffic down 98.3%, a shock that no valuation ratio would have warned you about.
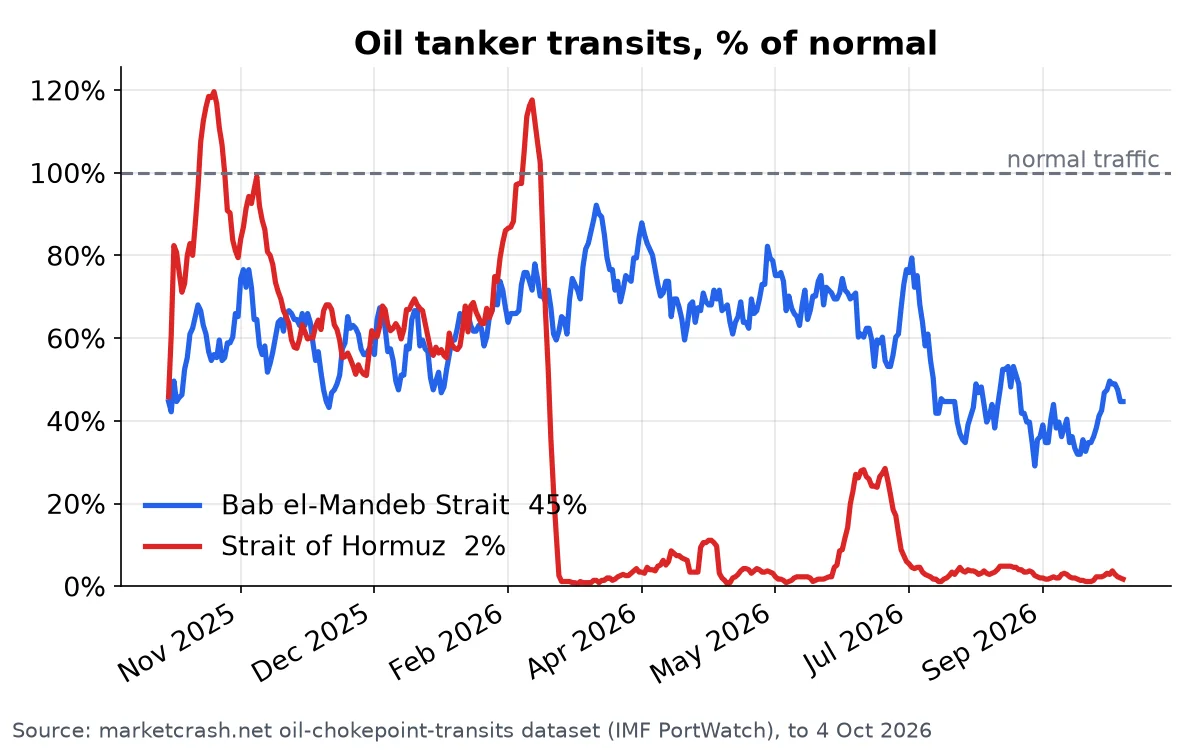
The chart comes from satellite data, so you see the disruption as it unfolds, not after prices have already moved.
From "the market is expensive" to "what do I buy?"
A high CAPE tells you the index is pricey. It doesn't tell you which stocks are already beaten down. MarketCrash's stock screeners now run every weekday after the US close. The screens include near the 52-week low, near the 52-week high, below book value, 14-week RSI under 30 and P/E under 15. You can sort the table by any column.
You can also stop checking by hand. Enter your tickers and an email, and watch alerts send you a mail on the day a watched stock joins or leaves any screen.
Comparison at a glance
- Valuation history: Multpl has long Shiller PE history. MarketCrash uses that history and shows it next to the other crash signals.
- Composite crash verdict: None on Multpl's homepage. MarketCrash has Crash Risk and Growth scores plus an overall regime.
- Risks beyond valuation: None on Multpl's homepage. MarketCrash monitors oil shock, AI debt, private credit, Treasury selling and the debt spiral.
- Stock screeners: None on Multpl's homepage. MarketCrash runs sortable screens every weekday.
- Alerts and email: None on Multpl's Shiller PE page. MarketCrash sends watch alerts and a weekly email when the signals move.
- Inside your AI assistant: MarketCrash runs as an app inside ChatGPT and Claude over MCP, with read-only tools for crash risk, indicators and market news.
Built for people who don't want to watch screens all day
The MarketCrash weekly email promises "At most one email a week, and only in weeks something actually moved." The same page adds: "No account, one click to unsubscribe, and the address is never shared." When the market is quiet, you hear nothing. When the signals turn, you hear about it.
If you love Multpl, keep it bookmarked for deep history. But if what you really want to know is how worried you should be right now, and what to do about it, a table of ratios won't tell you.
See today's crash risk now
The next shock won't wait for you to finish opening tabs. Open MarketCrash and check today's crash-risk score → Then set up a watch alert for your tickers, so you hear the day something changes.
MarketCrash is for educational and informational purposes only and is not investment advice.