Is This the Start of a Crash? The Nasdaq Fell 5.3% and the S&P 500 3.7% in One Day

The move
On Friday, Nov 20, the Nasdaq fell 5.28% to 22,617.73. The S&P 500 lost 3.70% to 6,910.39. It was the S&P 500's seventh losing day in a row. AI and chip stocks led the fall, and Anthropic gave back more than 9% after its record debut a day earlier (CBC).
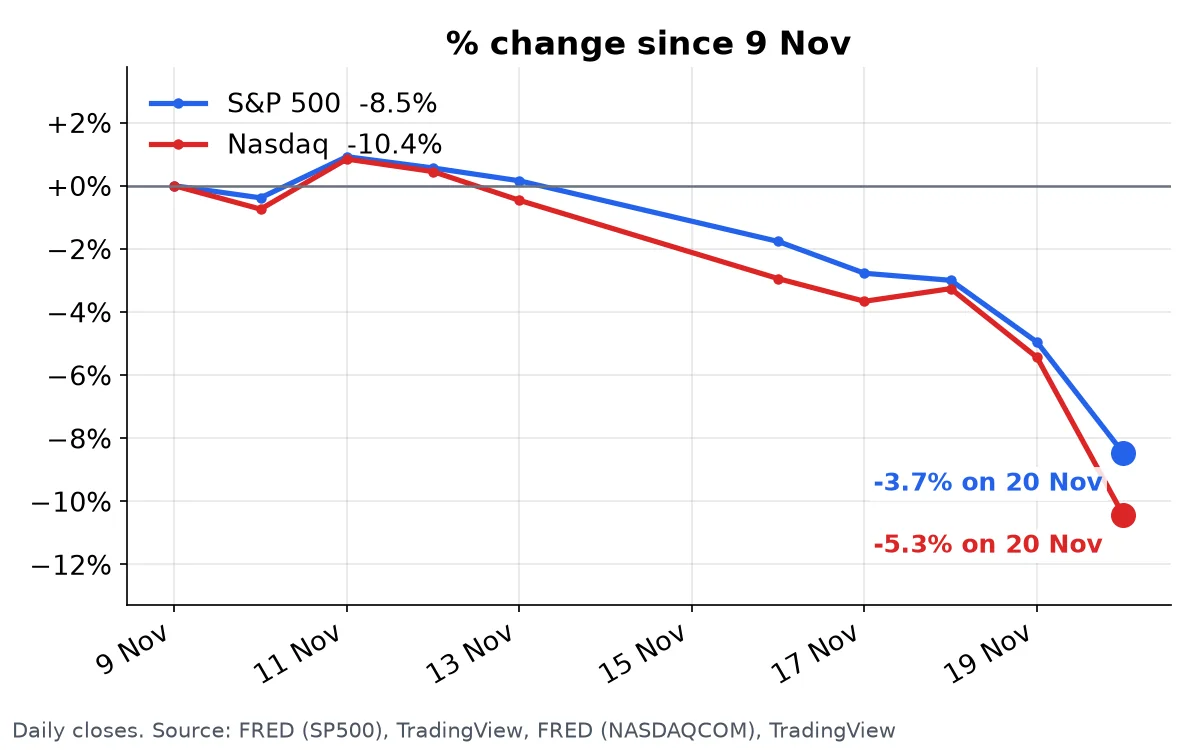
The S&P 500 is now 9.7% below its Nov 12 high and about 10% below its October record. A 10% drop is what Wall Street calls a correction. The VIX, the market's price of protection, jumped 33% in one day to 37.75.
What the numbers say
Fear and Greed Index: 0.8 out of 100, Extreme Fear. It was 18.5 on Monday. There is almost no room left below it.
Crash-risk score: 67%. Two of three crash warnings are on, the same as before the selloff began. The warnings are about price, and price is still high.
Buffett Indicator: 208% of GDP, down from 215% a day earlier. Even after a week like this, US stocks are worth twice the whole economy. Before the 2000 crash the reading was 146%.
Shiller PE: about 38. That is still near the dot-com top.
The closest past case
The Market Analogs page ranks every month since 1976 against today. The closest match is September 1999, an 85.1% match. All three top matches come from late 1999.
From there the S&P 500 still rose 12% in a year. Then March 2000 came, and the Nasdaq lost most of its value over the next two years. That is the uncomfortable part: the months that look like today were the last stretch before the crash, not the crash itself.
Is Friday the start? Nobody knows. But seven red days, fear at the floor and prices like 1999 are a setup that does not end quietly.
This post describes data only. It is not investment advice.
Don't find out from the headlines. Get the free weekly email: one email a week with the market note and the week's biggest moves.