MarketCrash Weekly Recap: Dollar Up, Real Rates Higher, Hormuz Nearly Shut (Week to 16 Nov 2026)

The week in brief
Three things moved this week. The US dollar got stronger, real interest rates rose, and the Buffett Indicator went up from the week before. Oil shipping through the main Middle East straits stayed badly disrupted. The data changelog has no entries for 9–16 November, so no methods or data sources changed this week.
Biggest moves
US Dollar Index. The US Dollar Index (DXY) is at 103.40. On 9 November it was 101.65, so it rose 1.75 points in the week to 16 November. Over three months it is up 3.76%. That is above the page's 1% line, so the status is NEGATIVE. On the last day of the week it barely moved (down 0.01).
Real interest rates. The 10-year real interest rate (TIPS yield) was 2.86% on 12 November, up from 2.60% on 5 November, a rise of 0.26 points. Over three months it is up 0.45 points. The site places this reading at the 99.5th percentile of 286 months since 2003. The site counts anything above 2% as a restrictive headwind, though the gauge's own status is POSITIVE.
Buffett Indicator. The Buffett Indicator (US stock market value divided by GDP) was 225.8% in the week to 13 November, up from 220.3% on 6 November. The latest daily print fell 1 point. The gauge is still about 8 points lower than three months ago. It is far above the page's 150% "Negative" line, so the status is NEGATIVE.
Oil chokepoints
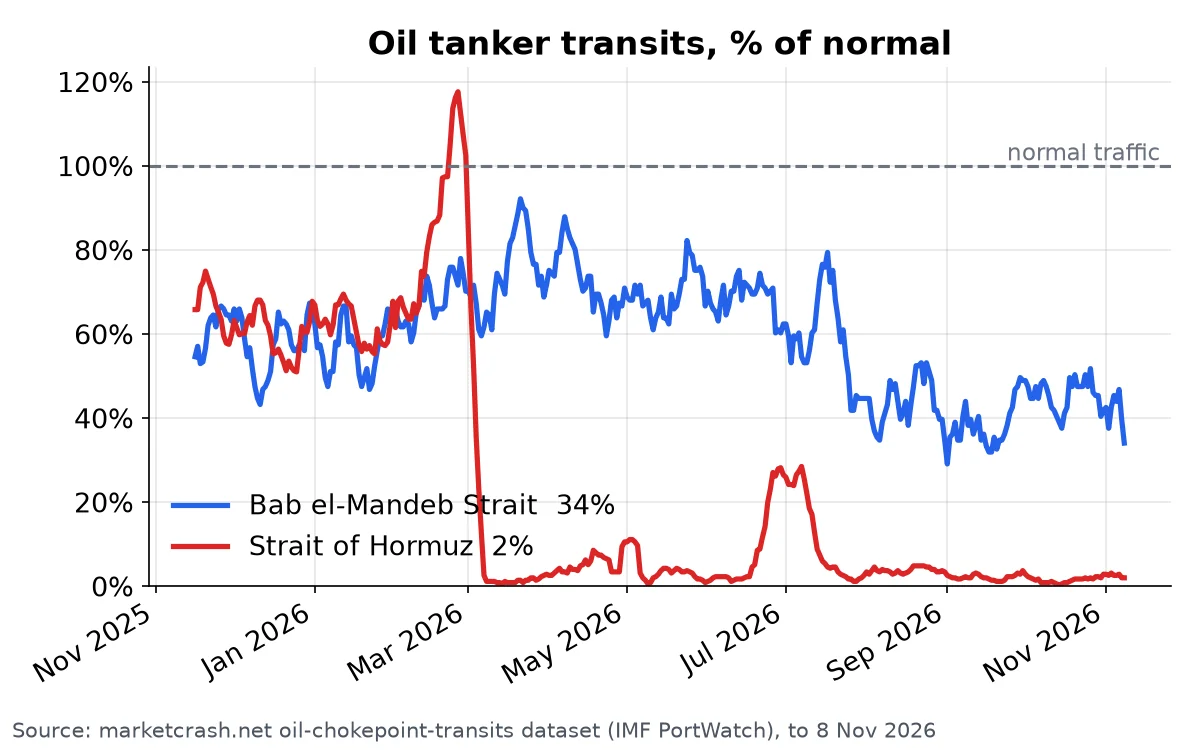
The Oil Shock page is rated Critical. On 8 November, about 1.0 tanker a day went through the Strait of Hormuz, against a normal 50.2. That is 98% below normal. Bab el-Mandeb had 6.9 tankers a day against a normal 20.1, which is 66% below normal and down 14% from the reading before. The page labels both straits "severe disruption." Brent crude was $92.14 a barrel on 11 November, up 2.2% from the reading before but only $0.11 higher than three months ago. US oil stocks covered 40.7 days in the week of 6 November, down 0.66 days.
Valuation and sentiment
- Shiller PE: 40 on 13 November. That is at the 98.5th percentile since 1871 and above the page's line of 35, so the status is NEGATIVE. It is down 1.05 over three months.
- Yield curve: the gap between 10-year and 2-year Treasury yields is 0.27%, up 0.03 on the day. The curve is still positive (POSITIVE status). The gap has narrowed by 0.24 points over three months.
- Fear & Greed Index: 19.9 out of 100, which counts as "Extreme Fear." This is the site's own version, built from four of CNN's seven inputs, so it will not match CNN's number.
Crash-risk and growth scores
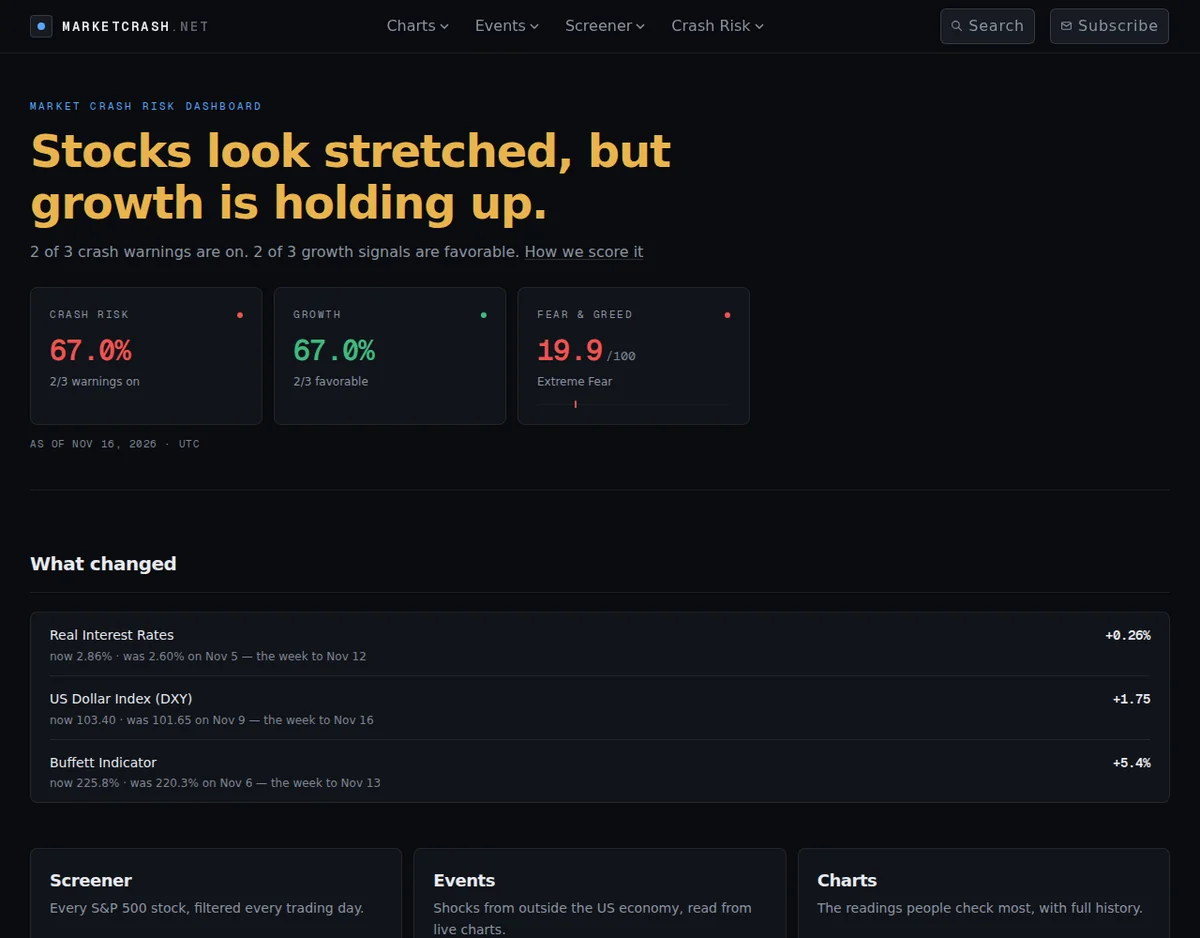
On 16 November the crash-risk score is 67%, with 2 of its 3 warnings on. The growth score is also 67%, with 2 of its 3 signals favorable. The dashboard does not show a weekly change for either score.
The event tracker also lists Treasury Dump and Debt Spiral as Critical, Private Credit as Elevated and AI Debt as Contained.
See every score and indicator live on the MarketCrash dashboard.