Is This the Start of a Crash? The Nasdaq Fell 2.5% Before Nvidia's Report

The move
On Monday, Nov 16, the Nasdaq fell 2.49% to 24,509.76. It was its third losing day in a row. The S&P 500 lost 1.92% to 7,416.59, and the Dow dropped 1.41% (closing numbers). Chip stocks led the fall after new limits on selling advanced chips abroad, and days before Nvidia's first report without Jensen Huang. The VIX jumped as much as 25% during the day.
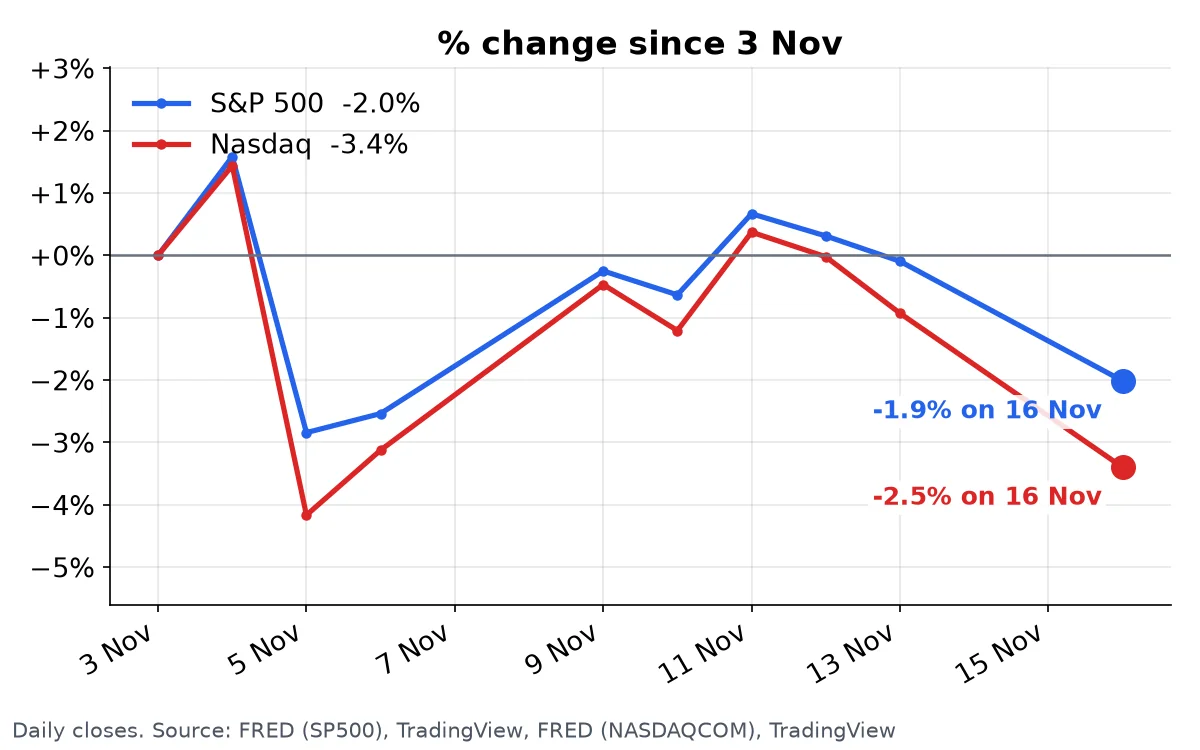
The S&P 500 is now about 3% below its close of Nov 11. That is not a crash yet. The question is whether the market is ready for one.
What the numbers say
Crash-risk score: 67%. Two of three crash warnings are on, and they were on before Monday.
Buffett Indicator: 221.5% of GDP on Nov 16, down from 225.8% on Nov 13. Even after the drop, US stocks are worth more than twice the whole economy. Before the 2000 crash it was 146%.
Shiller PE: 39.95. Stocks are priced near the dot-com top.
Fear and Greed Index: 18.5, Extreme Fear. Fear never left this market, even during last week's bounce.
The closest past case
The Market Analogs page ranks every month since 1976 against today. The closest match is September 1999, an 85.1% match with a Shiller PE of 41.3. All five top matches come from 1999.
After September 1999 the S&P 500 still rose 12% in a year. The top came in March 2000, and then the Nasdaq lost most of its value. The setup that looks like today was not the crash itself. It was the last stretch before it.
Is Monday the start? Nobody knows. But the market is priced like 1999, the AI trade is cracking, and Nvidia reports this week.
This post describes data only. It is not investment advice.
Don't find out from the headlines. Get the free weekly email: one email a week with the market note and the week's biggest moves.