MarketCrash Weekly Recap: Week to 9 Nov 2026

The week in one paragraph
All numbers here come from MarketCrash pages as they read on 9 November 2026. The biggest change is in sentiment. Our Fear & Greed reading is deep in Extreme Fear. The two long-run valuation measures came down from last week's levels but are still above their warning lines. Oil tanker traffic through the two Middle East chokepoints is still far below normal. The crash-risk and growth scores did not move in their signal counts.
Sentiment: Extreme Fear on every component
The Fear & Greed Index stands at 1.5 out of 100, labelled Extreme Fear. It was computed on 9 Nov against 252 trading days of history. Each of its four equally weighted parts is in the Extreme Fear range:
- Market volatility: VIX closed at 28.18 (score 1.2).
- Junk bond demand: the high-yield spread is 3.48 (score 0.0).
- Market momentum: the S&P 500 is 3.1 below its 125-day average (score 4.4).
- Safe-haven demand: the 20-day return gap between the S&P 500 and long Treasuries (TLT) is -10.51 (score 0.4).
This index uses four of CNN's seven components, so its reading will not match CNN's.
Valuations came down
The Buffett Indicator is at 220.3% on the dashboard, down 6.0 points from 226.3%. That reading is dated 6 Nov. Over three months it is down 12.49 points (-5.37%). It is still marked NEGATIVE.
The Shiller PE Ratio is at 38.9, down from 40.6, for October. Its three-month change is -2.09. It stays NEGATIVE, because the page's line for that is anything above 35.
Oil chokepoints
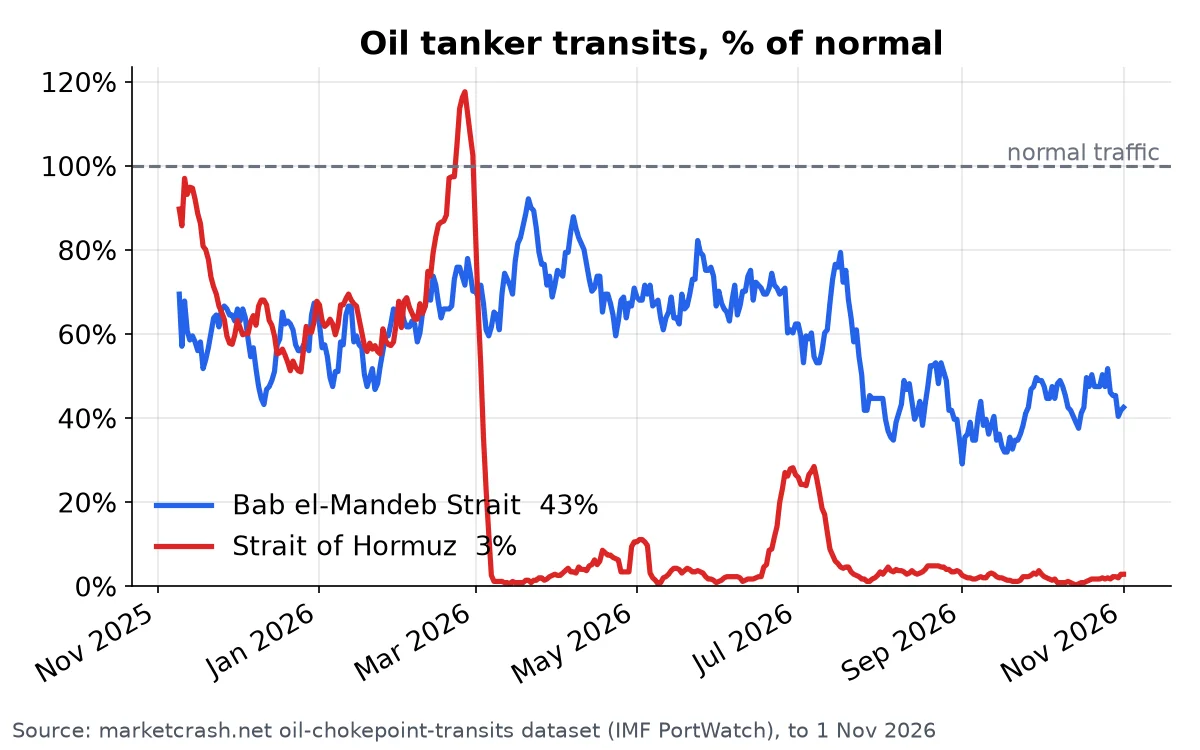
The latest data point for both straits is 1 Nov. Both use a 7-day mean of IMF PortWatch tanker counts.
- The Strait of Hormuz Oil Transits page shows 1.43 tankers a day. The 2019–2023 baseline is 50.2 a day, so traffic is about 2.8% of normal (-97.2%).
- The Bab el-Mandeb Oil Transits page shows 8.57 tankers a day. The baseline is 20.1 a day, so traffic is about 42.5% of normal. That is up 0.14 from the reading before.
Crash-risk score: 67%, HIGH RISK
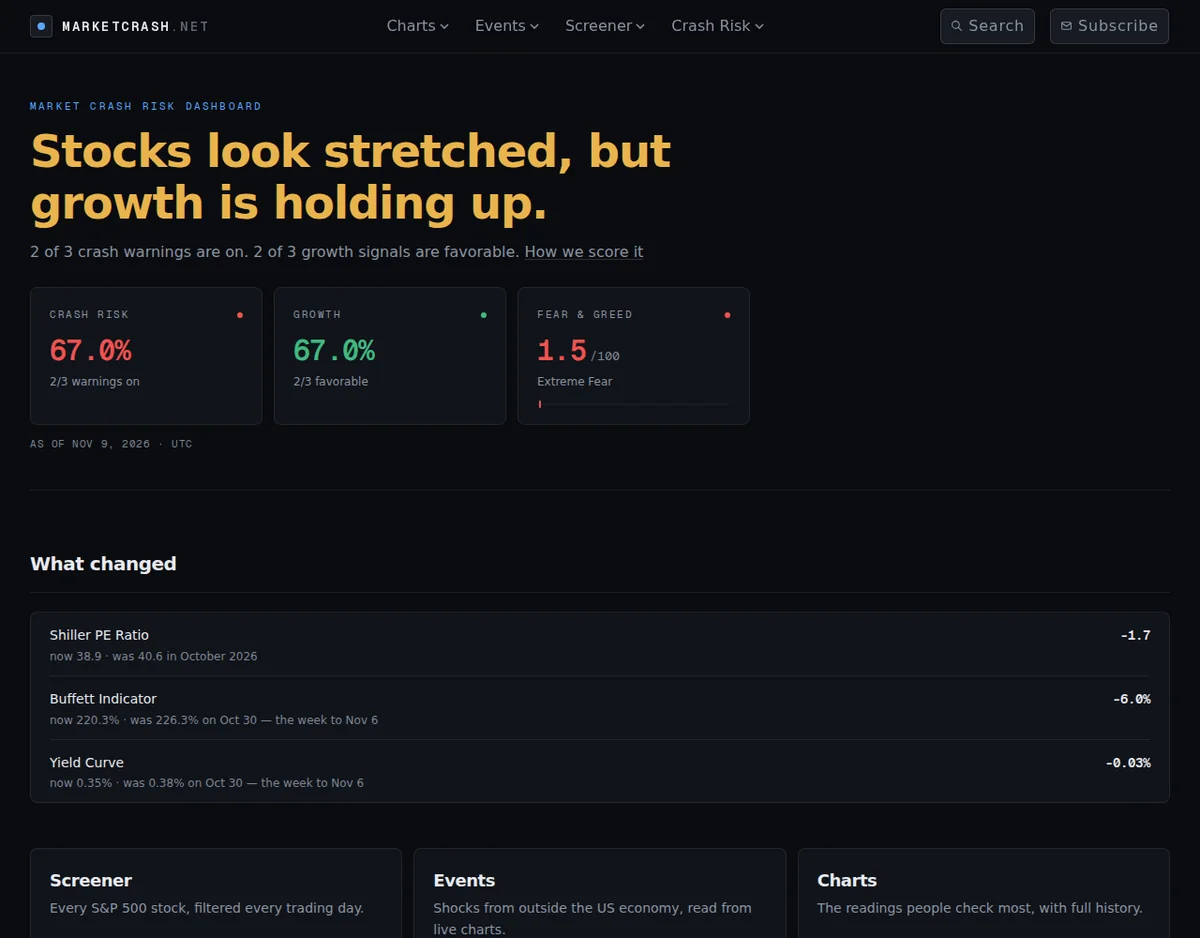
The crash-risk score is 67.0%, with 2 of 3 warnings on:
- The Buffett Indicator and the Shiller PE are both NEGATIVE.
- The Yield Curve (10Y–2Y) is POSITIVE at 0.35%, down from 0.38%. It is above the page's 0.2% warning line and is not inverted. Its three-month change is -0.11 points.
Growth score: 67%, HIGH GROWTH
The growth score is also 67.0%, with 2 of 3 signals favourable:
- The US Dollar Index (DXY) is at 102.07, down 0.23 on the day and up 2.26% over three months. It is the one unfavourable signal.
- US Money Supply (M2) is $23.4T as of 1 Sep, up 1.46% over three months. It is favourable.
- Real Interest Rates are at 2.60% on 5 Nov, down 0.04 from the reading before. That is the 99.5th percentile since 2003. The page marks the signal favourable, using its threshold of above 1%. The methodology page explains how each signal is scored.
Data changelog
The data changelog has no new entries this week. The latest fixes are from 25 July 2026.
See every live reading on the MarketCrash dashboard.