MarketCrash Weekly Recap: Week to 2 November 2026

The week in brief
The dashboard moved only a little this week. The yield curve widened, the dollar eased, and the Buffett Indicator came down slightly. The oil chokepoints remain the main story: tanker traffic through both straits is still far below normal. The two headline scores are unchanged at 67.0% each.
Biggest moves
Yield curve. The 10-year minus 2-year Treasury spread rose from 0.31% on 23 October to 0.38% on 30 October. That is the biggest move on the dashboard this week, at +0.07 percentage points. The spread is still positive, so this indicator stays POSITIVE. Over three months it is down 0.09 points. Yield Curve
Buffett Indicator. Total market value to GDP fell from 227.4% to 226.3%, a drop of 1.0 point. It remains far above the site's 150% line for NEGATIVE, at the 98.8th percentile of 382 months since 1995. Buffett Indicator
US Dollar Index. The DXY slipped from 101.96 on 26 October to 101.83, down 0.13. Its three-month change is still +1.94%, above the 1% threshold, so it reads NEGATIVE. US Dollar Index
Oil chokepoints
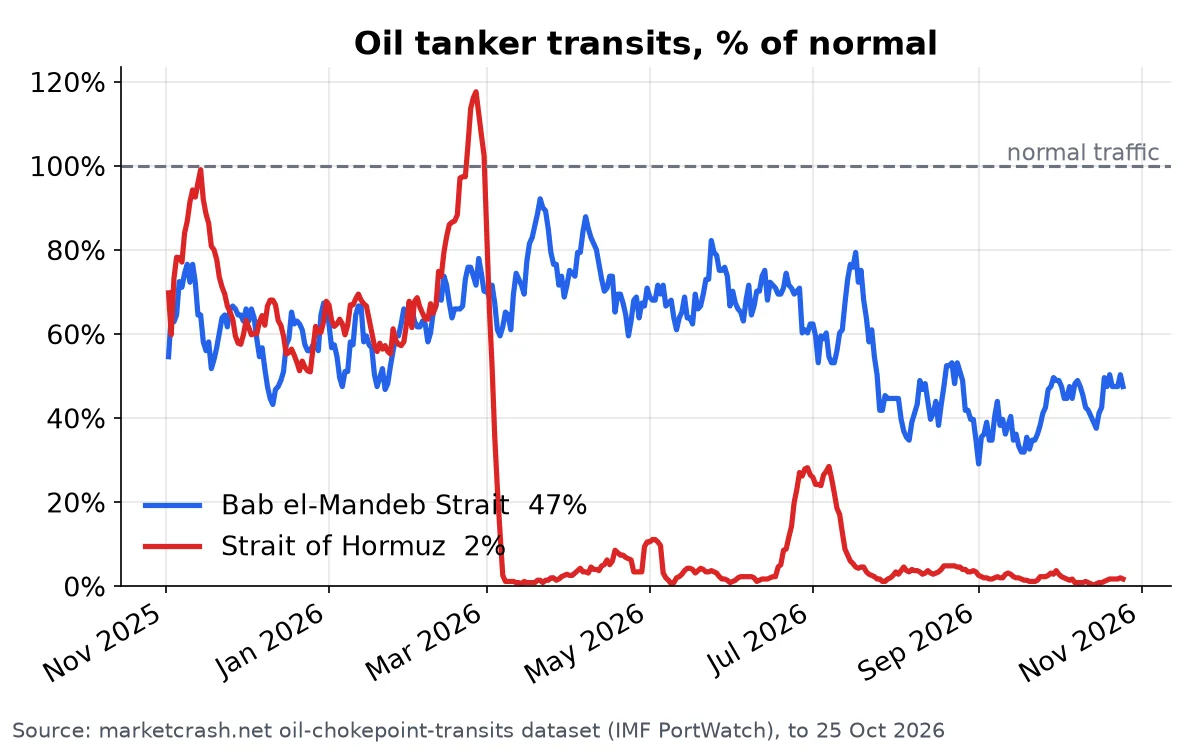
In the 7 days to 25 October, about 0.86 tankers a day went through the Strait of Hormuz. The normal level before the disruption was 50.2 a day, so traffic is 98.3% below baseline. The strait first closed in March 2026. Strait of Hormuz oil transits
The Bab el-Mandeb averaged 9.6 tankers a day against a baseline of 20.1, which is 52.5% below normal. Traffic there has been disrupted since July 2026. Bab el-Mandeb oil transits
The Oil Shock page still reads CRITICAL. It shows Brent crude at $123.10 a barrel on 27 October, up 33.9% over three months. For the week of 23 October it puts US crude supplies at 42.0 days of cover.
Crash-risk score
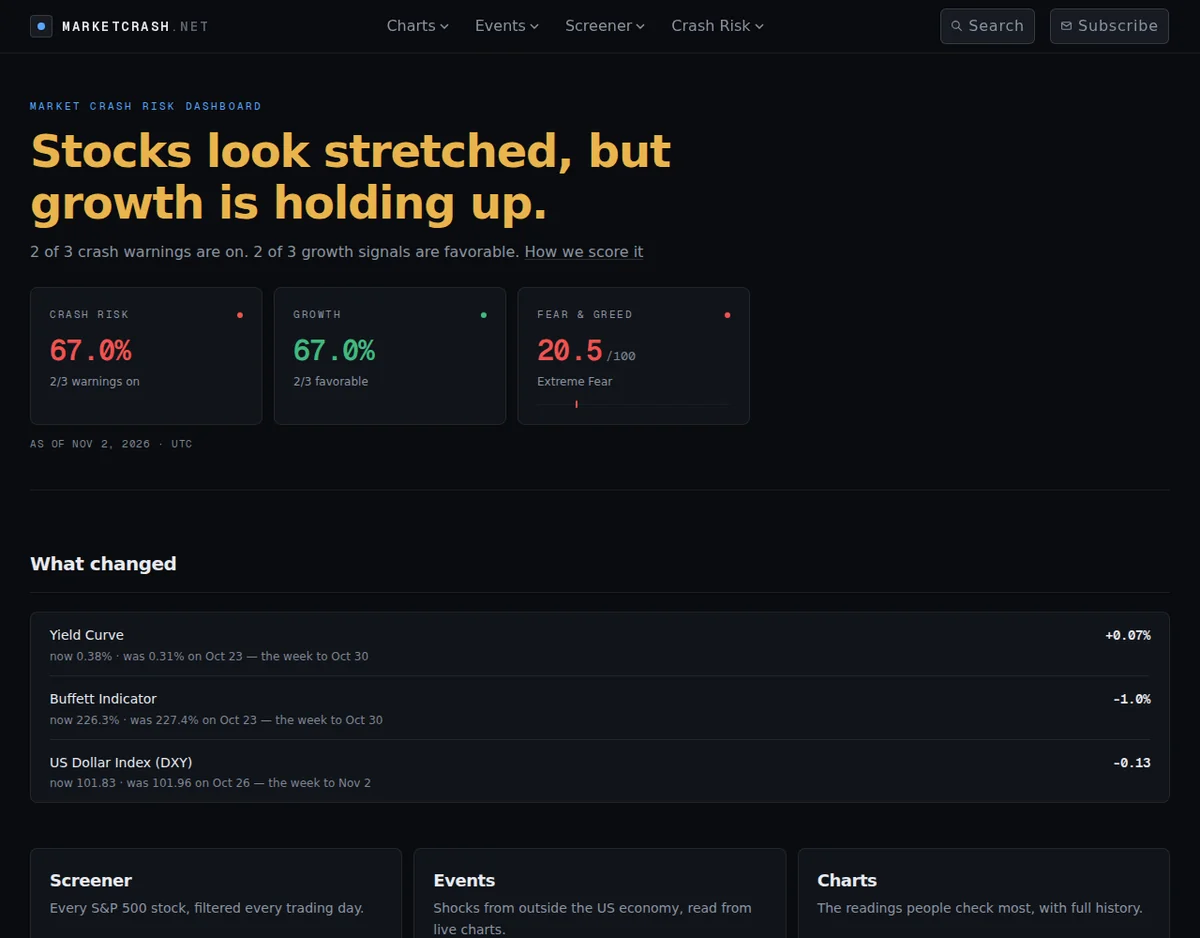
The crash-risk score is 67.0% (HIGH RISK), with 2 of 3 warnings on. Both warnings come from valuation:
- Buffett Indicator at 226%: NEGATIVE.
- Shiller PE at 40, above its 35 threshold and at the 98.7th percentile since 1871: NEGATIVE. Its three-month change is -0.87. Shiller PE Ratio
- Yield curve at 0.38%: POSITIVE, so no warning.
Growth score
The growth score is also 67.0%, with 2 of 3 signals favorable:
- M2 money supply is $23.4T (1 September data), up 1.46% over three months: POSITIVE. Money Supply
- Real interest rates (10-year TIPS) are 2.63% on 29 October, down 0.04 on the day and up 0.16 points over three months: POSITIVE. Real Interest Rates
- US Dollar Index: NEGATIVE, because its three-month rise is above 1%.
Sentiment and data notes
The Fear & Greed Index reads 20.5 out of 100, "Extreme Fear", computed on 2 November. The data changelog has no new corrections this week. Its latest entries are from 25 July 2026.
See every live reading on the MarketCrash dashboard.