MarketCrash vs MacroMicro: One Crash-Risk Verdict Instead of a Macro Research Workspace

You wanted an answer, not a research project
You've seen the headlines about the market and you want to know one thing: is it getting dangerous? So you open a macro charting platform. Before long you're comparing economic cycles and lining up indicators. You end up with lots of charts and still no verdict.
MacroMicro is one of the best-known macro chart platforms. It's a strong tool for people who want to do the research themselves. If what you want is a clear daily reading of crash risk, MarketCrash was built for that.
What MacroMicro is built for
MacroMicro is a research workspace. This review page lists macro dashboards for comparing economic cycles and market indicators, an ETF toolbox, correlation research, an economic events calendar, and institutional positioning from 13F holdings and COT futures data. MacroMicro also publishes its own recession-indicator roundups.
All of that has a cost. The same page says the Free tier is "for public macro chart exploration" and is limited to public macro charts and dashboards. On that page, MM PRO is listed at $20/mo for "unlimited macro charts and research", MM Prime at $25/mo, and MM Max AI at $30/mo. It also notes that downloads and APIs have their own terms, and that commercial chart use needs separate authorization.
If you're an analyst who likes building your own models, that can be well worth paying for. If you just want to know whether to worry today, it's more tool than you need.
What MarketCrash does instead
MarketCrash does the reading for you. The site describes itself as "a market-risk monitor built on Federal Reserve and market data. Six indicators, re-read through the day, combined into one crash-risk and one growth-probability score."
The headline on the homepage today: "Stocks look stretched, but growth is holding up." Underneath it says "2 of 3 crash warnings are on. 2 of 3 growth signals are favorable." On the live dashboard, Crash Risk reads 67.0% and Growth reads 67.0%. You get both in seconds, and a methodology page explains how each score is built.
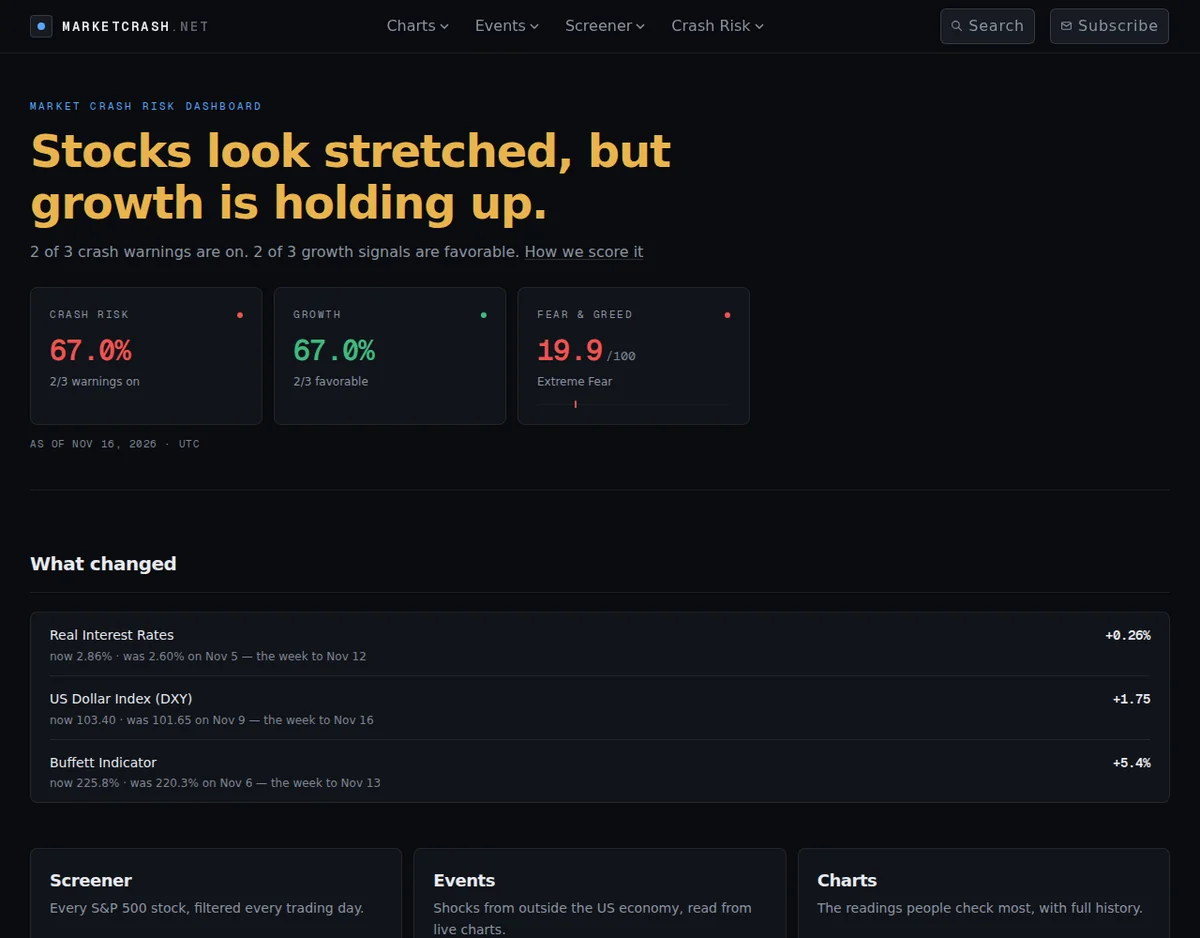
The homepage also has a What Changed strip, so you see which readings moved without opening every chart. This week real interest rates rose to 2.86%, the highest since 2008. Valuation gauges like the Buffett Indicator and the Shiller PE sit on the same dashboard, each color-coded Normal, Warning or Critical.
Signals from outside the economy, already on the page
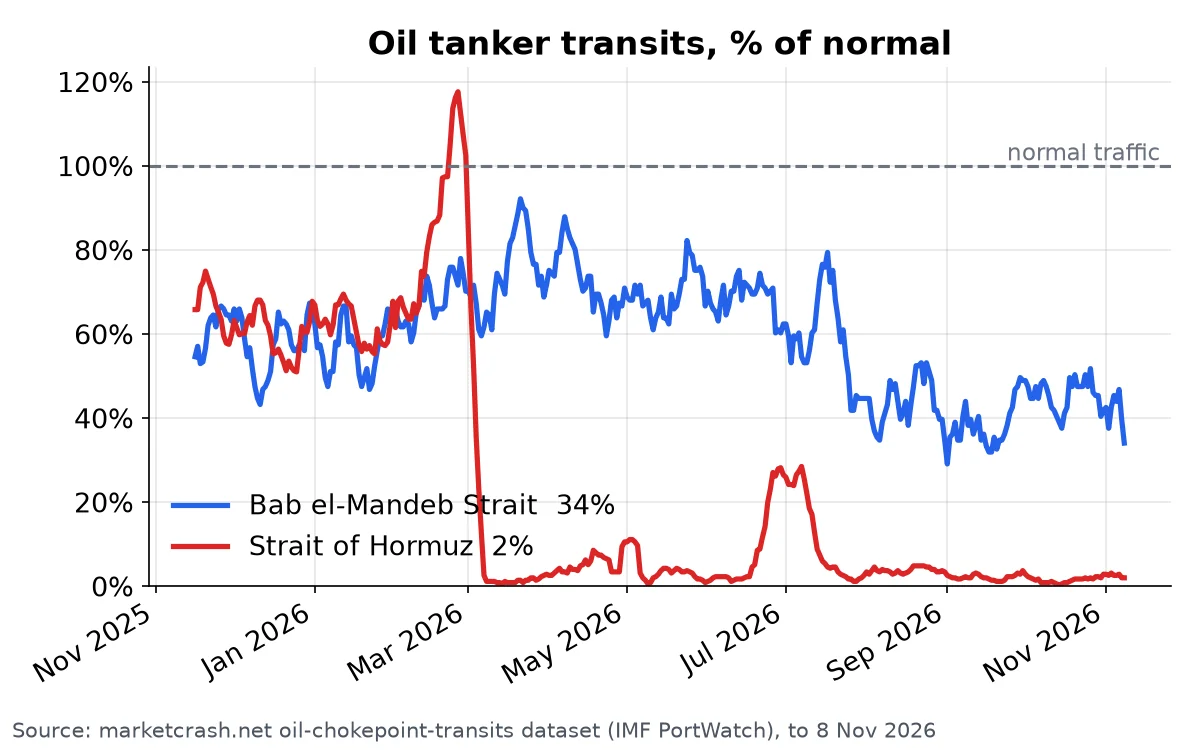
Crashes don't always start inside the US economy. MarketCrash has an Events section, described on the site as "shocks from outside the US economy, read from live charts". Each event gets a status label: Oil Shock, Treasury Dump and Debt Spiral read CRITICAL, Private Credit ELEVATED, and AI Debt CONTAINED.
Take the oil shock. MarketCrash tracks tanker traffic through the world's key oil chokepoints using satellite data:
There's a newer page too: Recession Odds pulls the 2026 and 2027 recession markets from Kalshi and Polymarket. It shows the yearly average, each market's 7- and 30-day move, and a year of daily history. So you see what people betting real money expect next to the economic data.
Head to head
- What you get: MacroMicro gives you a research workspace with dashboards, an ETF toolbox and correlation research (source). MarketCrash gives you one crash-risk score and one growth score, both explained.
- Cost to go deep: MacroMicro's paid tiers are listed from $20/mo to $30/mo, and the Free tier is limited to public charts (source). The MarketCrash homepage lists no paid tier, and the Free API is right in the site menu.
- Recession view: MacroMicro offers indicator charts for you to read yourself. MarketCrash shows a recession-probability page plus Kalshi and Polymarket recession odds.
- Outside shocks: MarketCrash labels Oil Shock, Treasury Dump, Debt Spiral, Private Credit and AI Debt from live charts.
- Stocks: MacroMicro has an ETF toolbox (source). MarketCrash runs a stock screener every trading day, with ready-made presets for cheap and beaten-down stocks.
- Getting told: MarketCrash sends a weekly email with a market note and the week's biggest moves, plus an alert when markets drop hard. No account is required, and you can unsubscribe in one click.
Who should pick which
If you build your own macro models, want 13F and COT positioning data, and are happy to pay for unlimited research, MacroMicro fits you.
If you want to know today whether the market looks dangerous, without paying for a subscription or putting together your own dashboard, MarketCrash is the better choice. It does the reading for you and emails you when things change.
Don't find out from the headlines
Most of the crash warnings on the live dashboard are on right now. Real rates are the highest since 2008, and several outside-shock events read CRITICAL. If you wait for the headlines, you hear about it last.
Open the live MarketCrash dashboard → Check today's crash-risk score, then sign up for the weekly digest so you hear when the market turns.
Market risk data is provided for educational and informational purposes only. It is not investment advice or a trading recommendation.