MarketCrash vs YCharts: Crash Signals Without the Sales Call

You just want to know: is the market about to crack?
You've seen the headlines. Stocks look expensive and the Nasdaq just had an ugly day. So you go looking for the numbers that warned before past crashes: the Buffett Indicator, the Shiller PE and the yield curve.
Then you land on a professional research platform. YCharts is a serious tool. Its menu lists pages for advisors, large RIAs, banks and trust companies, and asset managers. The way in is a "7-Day Free Trial". A pricing aggregator says "YCharts doesn't publish prices — plans are quote-based". The same page describes the Professional plan as aimed at investment managers and RIAs.
If you manage client money, that may be just what you need. If you're an individual investor who wants a straight answer before the open, that's a lot of platform to get through to read a few signals.
The after-state: one page, one answer
Open MarketCrash and the answer is at the top. The headline gives it in plain English: "Stocks look stretched, but growth is holding up." Under it you get one crash-risk score, one growth score and a Fear & Greed reading. This week the fear index sits at 1.5, deep in "Extreme Fear".
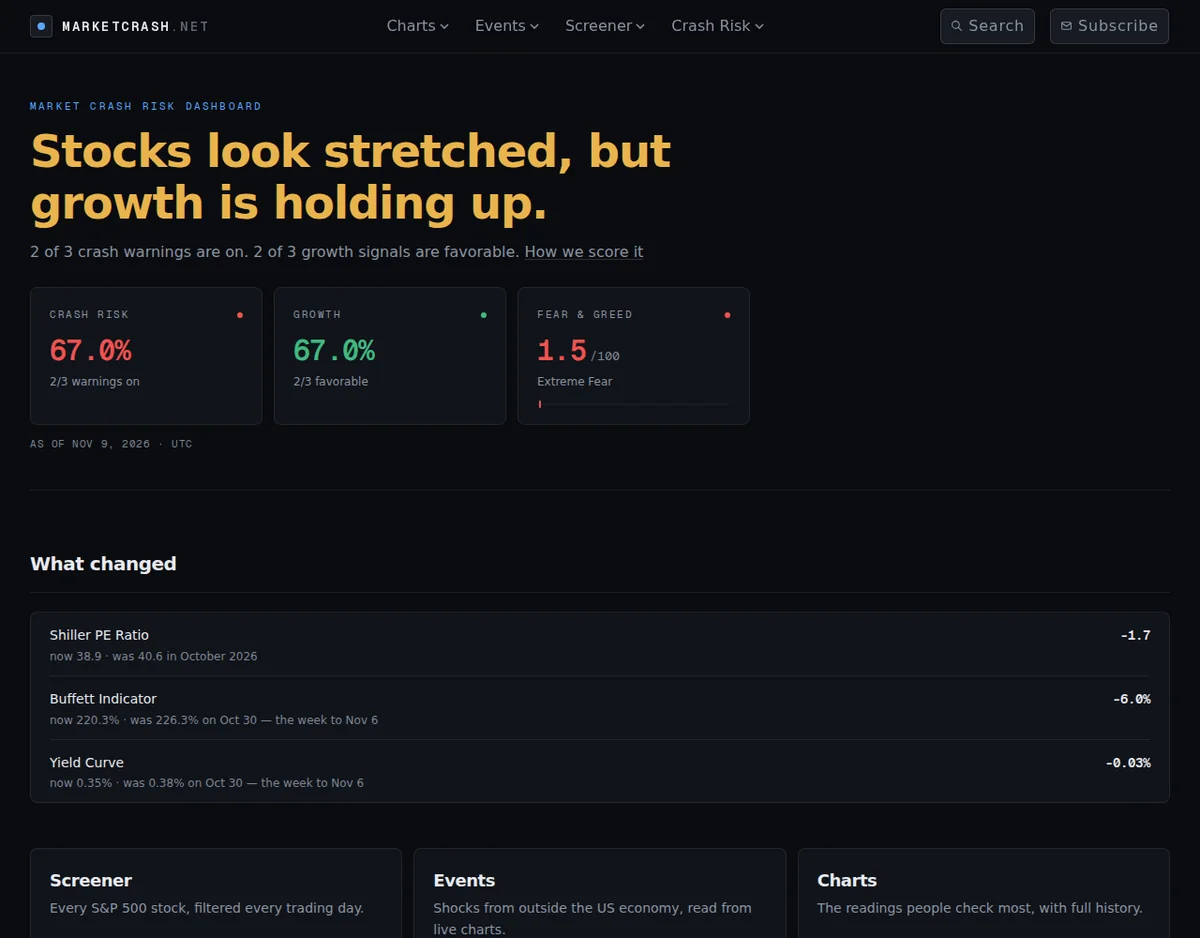
You don't build a chart or pull data yourself. The "What changed" panel on the dashboard shows how the Shiller PE, the Buffett Indicator and the yield curve moved since their last reading. Each signal is color-coded Normal, Warning or Critical, so you can tell at a glance which ones matter.
The Buffett Indicator: useful, but not a magic button
YCharts has published one of the more honest studies of the Buffett Indicator. Going back to 1971, the indicator warned ahead of 7 of 14 declines of 10% or more, flagging overvaluation a median of 24.2 months early. With a stricter threshold in the years since 2000, the same study found it gave no warning before the 2007–09, 2015–16 and early 2018 declines.
The lesson: one valuation ratio won't time a crash. So MarketCrash doesn't lean on one metric. Our dashboard is built on "Six indicators, re-read through the day, combined into one crash-risk and one growth-probability score". Valuation, the yield curve, unemployment and inflation come from official sources such as the Federal Reserve's FRED database. Then we add the outside shocks a valuation ratio can't see.
Shocks from outside the US economy, read from live data
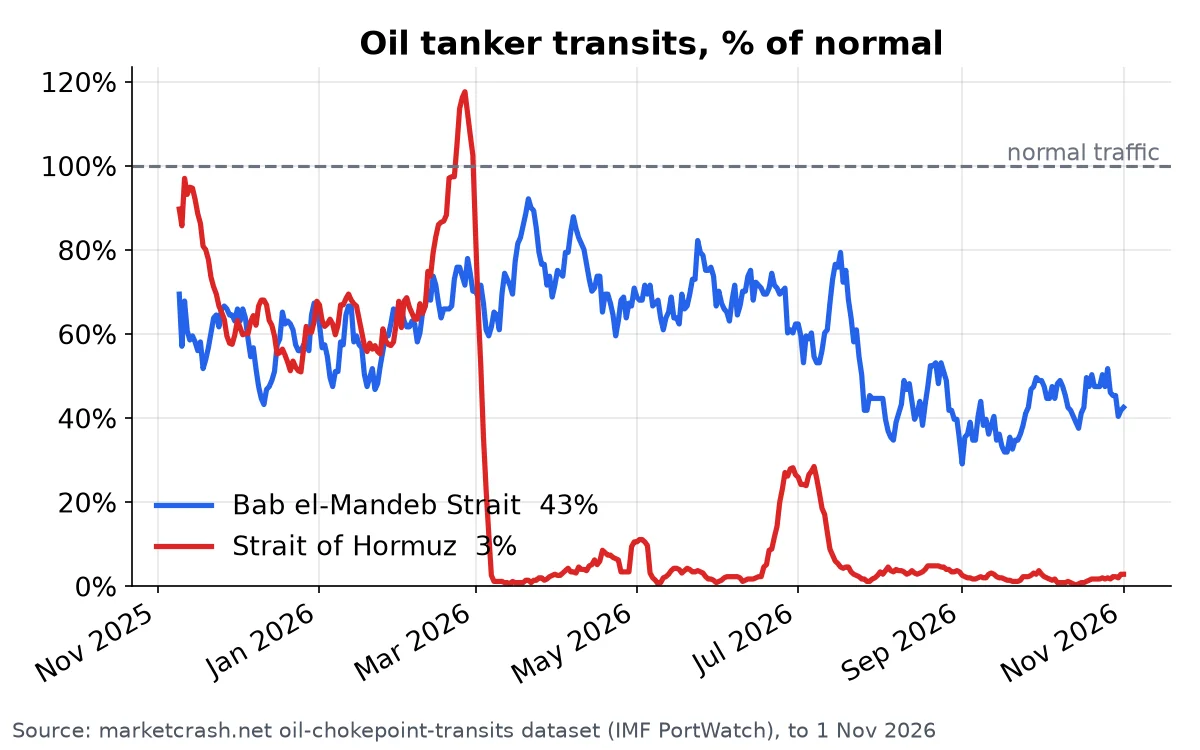
The Events panel on MarketCrash rates the risks that come from outside the US economy. Right now it shows Oil Shock: CRITICAL, Treasury Dump: CRITICAL, Debt Spiral: CRITICAL, Private Credit: ELEVATED and AI Debt: CONTAINED. Each rating rests on data, such as tanker traffic through the world's oil chokepoints:
Get told when the market turns
A dashboard only helps if you remember to check it. MarketCrash also sends "The weekly digest when crash risk or a big indicator moves, plus an unscheduled alert when markets drop hard". When the Nasdaq fell 5.5% on Nov 5, an alarm post went out on our blog. We also fixed the drop alert so it now reads fresh prices on every run, not a cached copy from the day before.
Signing up is short: you enter your email and confirm it. The form says "No account" and "We never share your address". There's no trial clock and no sales call.
MarketCrash vs YCharts at a glance
- Built for: MarketCrash is for individual investors who want a fast read on market risk. YCharts has pages for advisors, RIAs, banks and asset managers.
- How you get in: MarketCrash has no account and no form between you and the dashboard. YCharts offers a free trial, and its plans are quote-based.
- Answer at a glance: MarketCrash gives you one crash-risk score, one growth score and a Fear & Greed reading. YCharts is a research platform where you build your own analysis.
- Outside shocks: MarketCrash rates oil, Treasury, debt-spiral, private-credit and AI-debt risk.
- Alerts: MarketCrash sends a weekly digest when something moves and an unscheduled alert when markets drop hard.
- Extras: MarketCrash also has a daily stock screener, recession and market-analog pages, and a Free API.
Who should pick which
If you run a practice and need deep, exportable research across many securities, YCharts was built for that job. If you're an individual investor who wants to know whether risk is rising, see what changed this week and get an email when it matters, MarketCrash gets you there faster.
With the fear index at 1.5 and the Nasdaq just down 5.5% in a day, this is the kind of week when you want to watch the signals as they change, not piece them together afterward.
Check today's crash risk now
👉 Open the live MarketCrash dashboard to see today's scores, then click "Get market updates" so the next big move lands in your inbox.
Market risk data is provided for educational and informational purposes only. It is not investment advice or a trading recommendation.