MarketCrash vs CNN Fear & Greed Index: Mood Plus Valuation, in One Place

The needle says "fear." So what do you do?
You've done this before. Stocks slide, you open the Fear & Greed dial, and the needle has swung left. Now what? Is it panic that will pass soon, or a market that was too expensive from the start? The dial can't tell you, because it was never built to answer that.
The CNN Fear & Greed Index is a sentiment gauge, introduced by CNN Money in 2012. Even guides that explain it say it "doesn't account for fundamental market factors" and "should not be used as a standalone predictor of market movements."
Mood without valuation is half the picture. MarketCrash shows you both halves.
What CNN's index does well
CNN's index is broad. It blends seven equally weighted indicators: stock price momentum, stock price strength, stock price breadth, put and call options, junk bond demand, market volatility and safe-haven demand. If all you want is one well-known reading of how nervous traders are, it does that job.
But most investors don't stop at "how nervous are people?" The next question is "should I be nervous too?" To answer that, you need valuation, the bond market and macro risks next to the mood reading.
What MarketCrash shows next to the fear reading
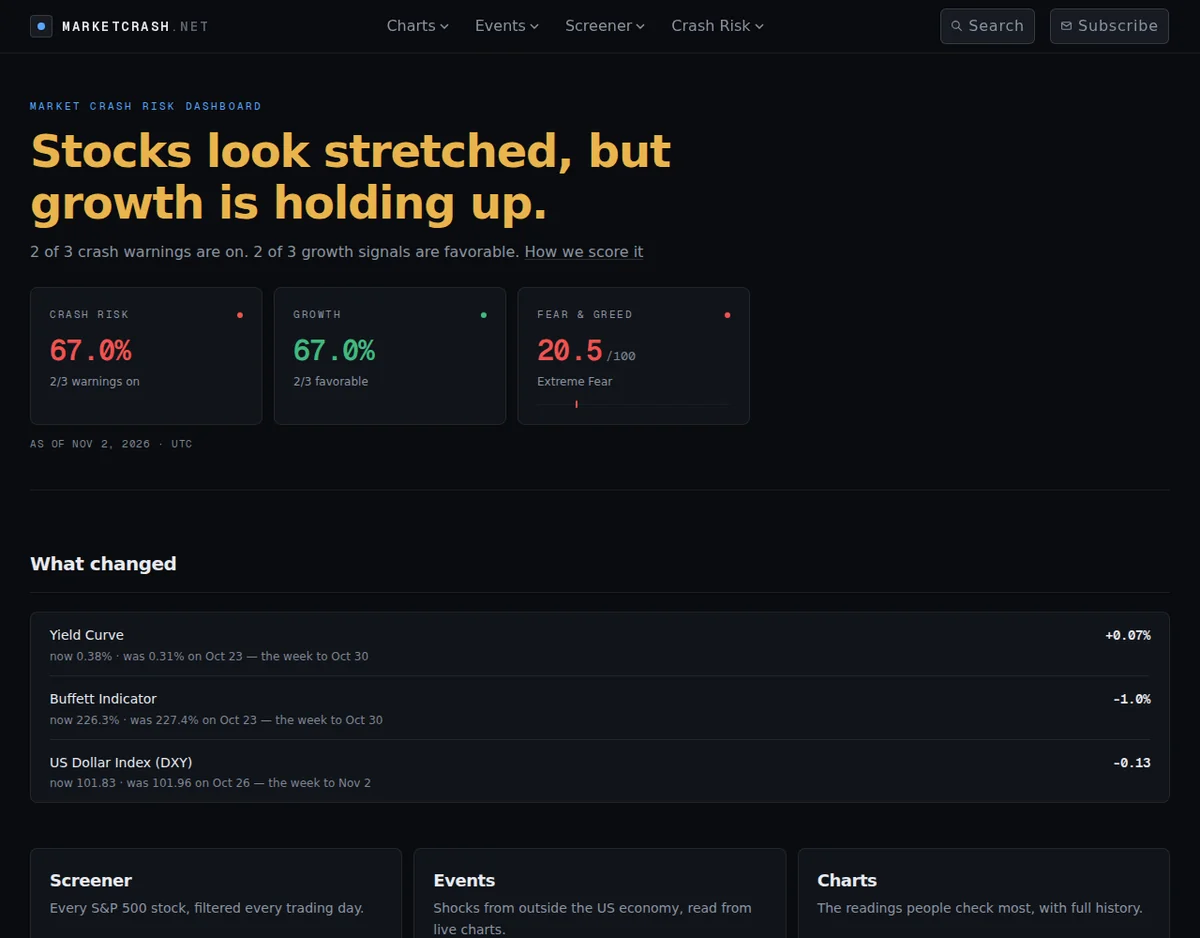
A fear gauge that shows its working. MarketCrash has its own fear and greed gauge, and it has been stuck at 20.5, deep in the Extreme Fear band that the site paints below 25. It is an equal-weighted average of four components: market volatility (VIX), junk bond demand (high-yield spread), market momentum (the S&P 500 against its moving average) and safe-haven demand (stocks against long Treasuries). The free sentiment API publishes each component's source series, raw value, score and weight, so you can check the math yourself.
A crash-risk score built on valuation. This is the number a mood dial can't give you. MarketCrash's crash-risk score counts how many of its crash indicators read negative: the Buffett Indicator (market cap to GDP, Warren Buffett's preferred valuation metric), the 10Y–2Y yield curve and the Shiller PE. The methodology is plain counting against fixed thresholds, with no weighting and no model fitting.
A growth score to balance it. A matching growth score counts how many growth indicators (the dollar index, M2 money supply and real interest rates) read positive. The two scores combine into one label: Growth Positive, Crash Risky or Neutral Market.
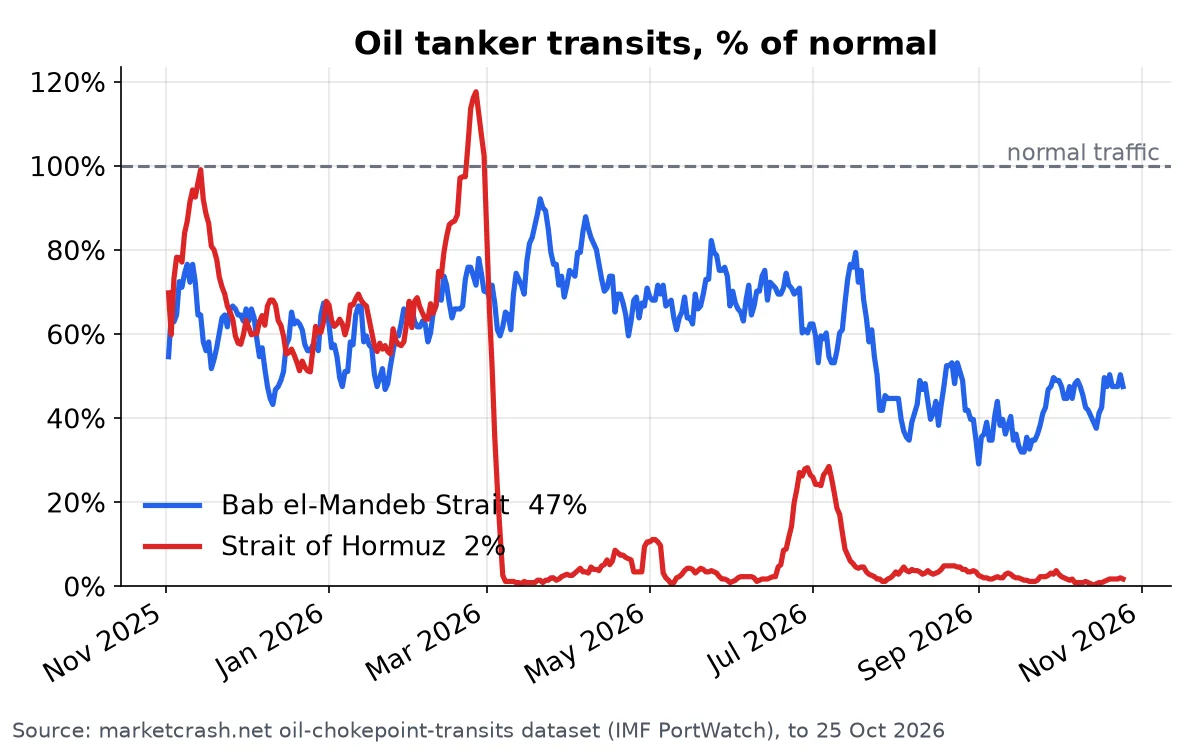
Shocks from outside the US economy. MarketCrash also tracks events read from live charts, including Oil Shock, AI Debt, Private Credit, Treasury Dump and Debt Spiral, each with its own status. The oil reading comes from tanker traffic through the Strait of Hormuz and Bab el-Mandeb, built from IMF PortWatch satellite data:
Head to head
- What it measures: CNN measures market sentiment from seven indicators. MarketCrash gives you a fear gauge plus a valuation-based crash-risk score, a growth score and macro-shock statuses.
- Fundamentals: Guides say CNN's index doesn't account for fundamental market factors. MarketCrash puts the Buffett Indicator, the Shiller PE and the yield curve front and center.
- Transparency: MarketCrash publishes each fear component's source series, raw value, score and weight as JSON.
- Charts: MarketCrash's chart library runs from M2 and real rates to the Strait of Hormuz.
- Stocks: MarketCrash's screener covers every S&P 500 stock, filtered every trading day, with ready-made presets such as near-lows and oversold names. You can also build your own screen.
- Alerts: MarketCrash emails you with no account needed. A market drop alert fires when an index falls 2% in a session, when an index is 5% below its 5-day high, or when the VIX spikes 25% or closes above 30 in a falling market. Unsubscribing takes one click.
- Data access: MarketCrash has a free public API with no key and no sign-in. You get 1000 calls a day and 60 a minute from one address, across the scores, each indicator, the fear gauge, market series, macro risks and stock screens.
Who should switch
If you only want a quick read on the market's mood, CNN's dial will do. But if you've ever seen "Extreme Fear" and wondered whether it was a buying chance or a warning, you need the context MarketCrash adds. Is the market cheap or expensive? Is the yield curve sending a signal? Is something breaking outside the US?
And the project keeps shipping. Recent updates make the fear alert fire at the same band the site paints, add retries when FRED or IMF PortWatch turn a request away, and open the public API with 17 endpoints.
Don't read the mood alone
Fear is stuck in the extreme band right now, so this is the worst time to read sentiment without valuation. Open the dashboard and see the crash-risk and growth scores side by side in seconds. Then leave your email so the next sharp drop reaches you before the headlines do.
See today's crash-risk score on MarketCrash →
MarketCrash data is for educational and informational purposes only. It is not investment advice or a trading recommendation.