Weekly Market Recap, 26 Oct 2026: Real Rates Ease, Hormuz Still Near Zero

The week in brief
This week the big moves were small and in rates. Real interest rates fell, the yield curve flattened a little and the dollar slipped. The bigger story is still oil supply: tanker traffic through the Strait of Hormuz remains close to zero. The data changelog has no new entries this month. Its most recent corrections are dated 25 July 2026.
Biggest moves
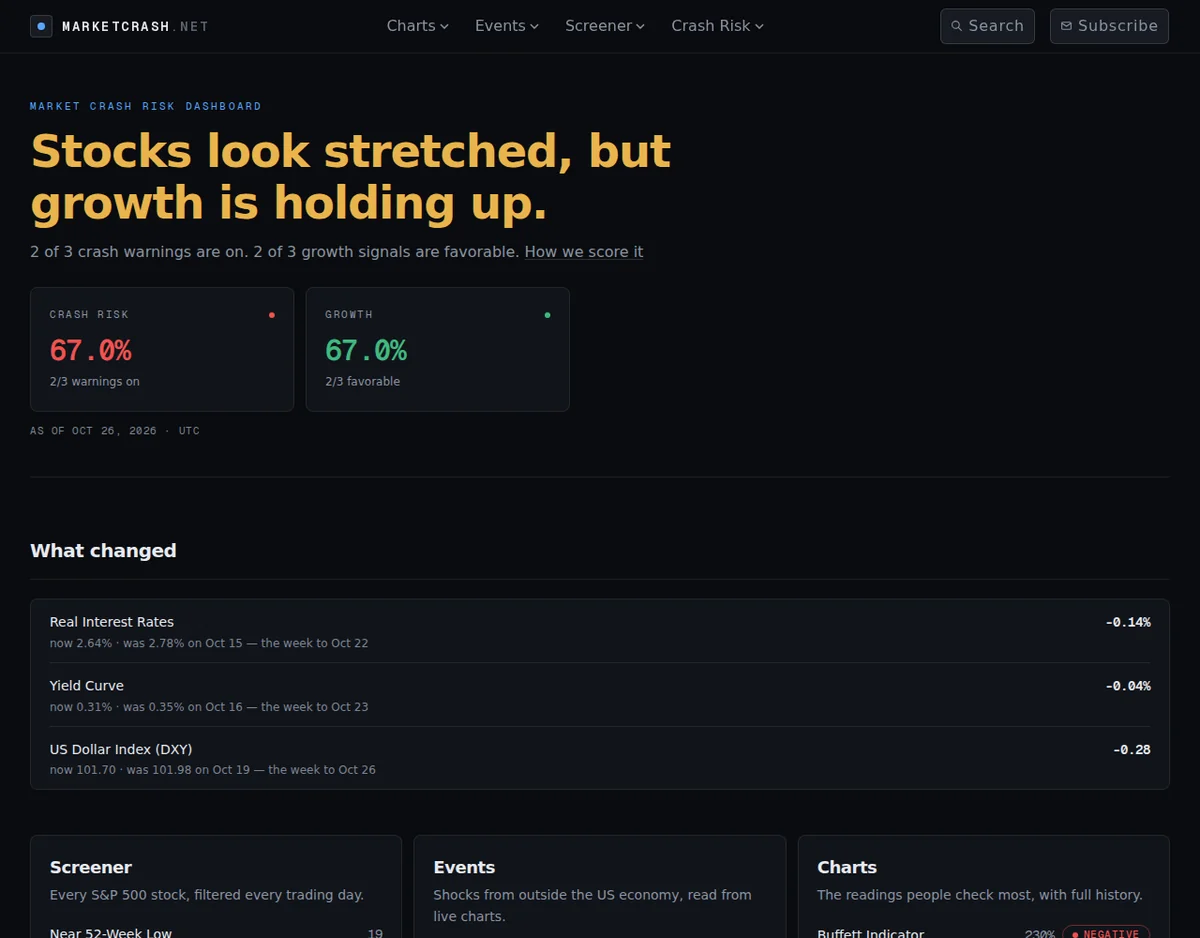
Real interest rates. The 10-year TIPS yield was 2.64% on 22 Oct, down from 2.78% on 15 Oct, a drop of 0.14 points. It is still 0.21 points higher than three months ago and sits at the 98.6th percentile of 285 months since 2003. The status is POSITIVE.
Yield curve. The 10Y-2Y Treasury spread was 0.31% on 23 Oct, down from 0.35% on 16 Oct. It is not inverted and stays POSITIVE. Over three months it has narrowed by 0.05 points.
US Dollar Index. The DXY was 101.70 on 26 Oct, down from 101.98 on 19 Oct. It is up 0.32% over three months, and the page marks it WARNING. On the site's scale, 101.70 is in the 100–110 "strong dollar" range.
Oil chokepoints
The Oil Shock event page is still CRITICAL. The latest satellite counts are from 18 Oct:
- Strait of Hormuz: 0.57 tankers a day (7-day mean), against a baseline of 50.2. That is −98.9% versus normal. It is up from about 0.43 at the previous chart point, but still close to zero.
- Bab el-Mandeb: 10.0 tankers a day against a baseline of 20.1, or −50.4%. This is up from about 8.57 at the previous point.
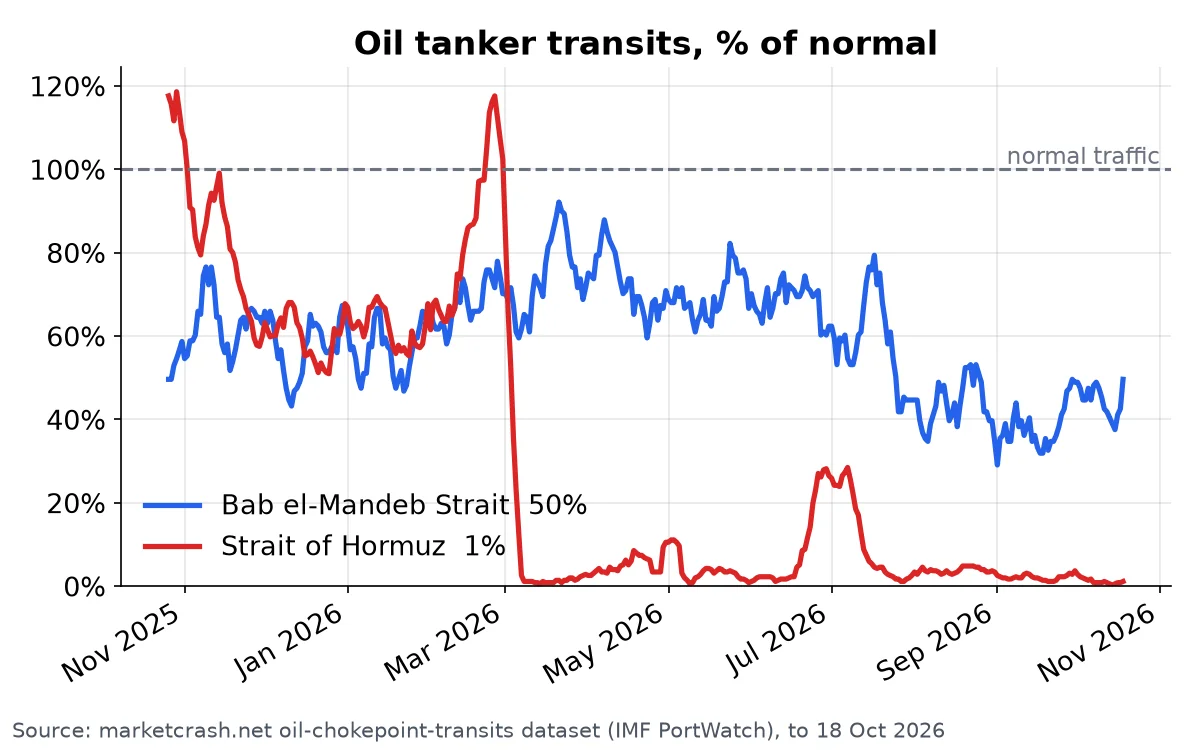
Brent crude was $115.22 a barrel on 20 Oct. That was $3.60 lower than the day before but $21.10 (+22.4%) higher than three months ago. US oil cover, commercial stocks plus the Strategic Petroleum Reserve (SPR), was 41.8 days in the week of 16 Oct. The peak was 55.0 days in October 2025.
Crash-risk and growth scores
On 26 Oct the dashboard shows crash risk at 67%, with 2 of 3 warnings on, and growth at 67%, with 2 of 3 signals favorable.
Valuations explain most of the crash-risk side:
- The Buffett Indicator was 230% on 23 Oct. That is 5 points higher than three months ago and at the 99.3rd percentile since 1995. Status: NEGATIVE.
- The Shiller PE ratio was 40. It is 0.64 lower than three months ago but still at the 98.7th percentile since 1871. Status: NEGATIVE.
Event watch
The Treasury Dump page is CRITICAL. Japan held $1,068.3bn in US Treasuries on 1 Aug, down $35.7bn in a month and 9.77% over a year. The page warns that these are market values, so rising yields alone can lower the figure. The 10-year Treasury yield was 4.96% on 22 Oct. The Debt Spiral event is also CRITICAL, Private Credit is ELEVATED and AI Debt is CONTAINED.
Data notes
The data changelog has no new entries for October. Its latest entries are from 25 July 2026: a corrected real-rates source, the fix for the Buffett Indicator dropping to zero on days without a closing price, and a rule that a failed data source now shows an error instead of sample numbers.
See every live reading on the dashboard at marketcrash.net.