MarketCrash vs GuruFocus: One Crash-Risk Verdict Instead of One Valuation Gauge
The problem with checking one gauge
You keep hearing that stocks are stretched, so you look up the Buffett Indicator. Most people end up on GuruFocus's Buffett Indicator page, which tracks "the percent of total market cap relative to GNP". The page is well known, and it does that one job well.
But you still have work left. Is the yield curve still flashing a warning? Is a shock building outside the US economy, like an oil squeeze or a Treasury selloff? Is growth holding up? And what has changed since you last looked? Valuation is one input. A decision needs all of them, and it needs a fresh look every time you check.
MarketCrash was built to close that gap.
What GuruFocus gives you
To be fair, GuruFocus covers a lot of ground on valuation. Besides the US page, it shows the same ratio for other countries, such as Japan, the UK and China. Its US page also has a modified version of the ratio that adds Federal Reserve assets, plus an estimate of the market's implied future return. Beyond that, GuruFocus is a value-investing research platform with paid membership plans.
If you want valuations country by country, or deep research on single stocks, GuruFocus is built for you. If your question is "how risky is this market right now, and should I pay attention this week?", read on.
What MarketCrash gives you: the whole picture in one sentence
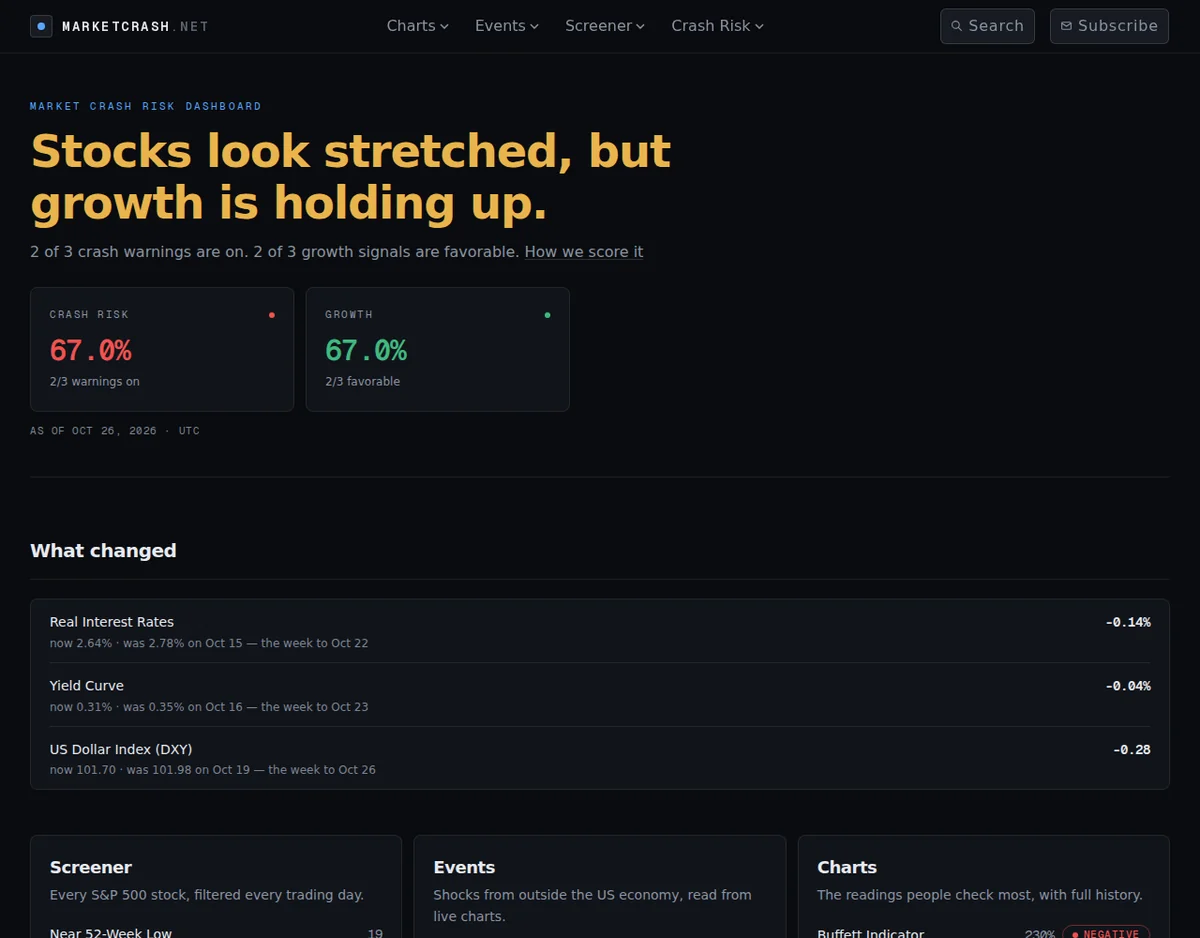
Open marketcrash.net and the top of the page answers that question in plain words. Today it says: "Stocks look stretched, but growth is holding up."
That verdict comes from two scores, built on data from the Federal Reserve (FRED) and the markets:
- Crash Risk: how many crash warnings are switched on right now
- Growth: how many growth signals are favorable
You also see every input behind the verdict, each with a color-coded status (Normal, Warning or Critical): the Buffett Indicator, the Shiller PE (CAPE), the 10Y-2Y yield curve spread, the US Dollar Index, unemployment, inflation and more. So the Buffett Indicator is still there. It just sits next to the other signals that matter.
The risks a valuation page leaves out
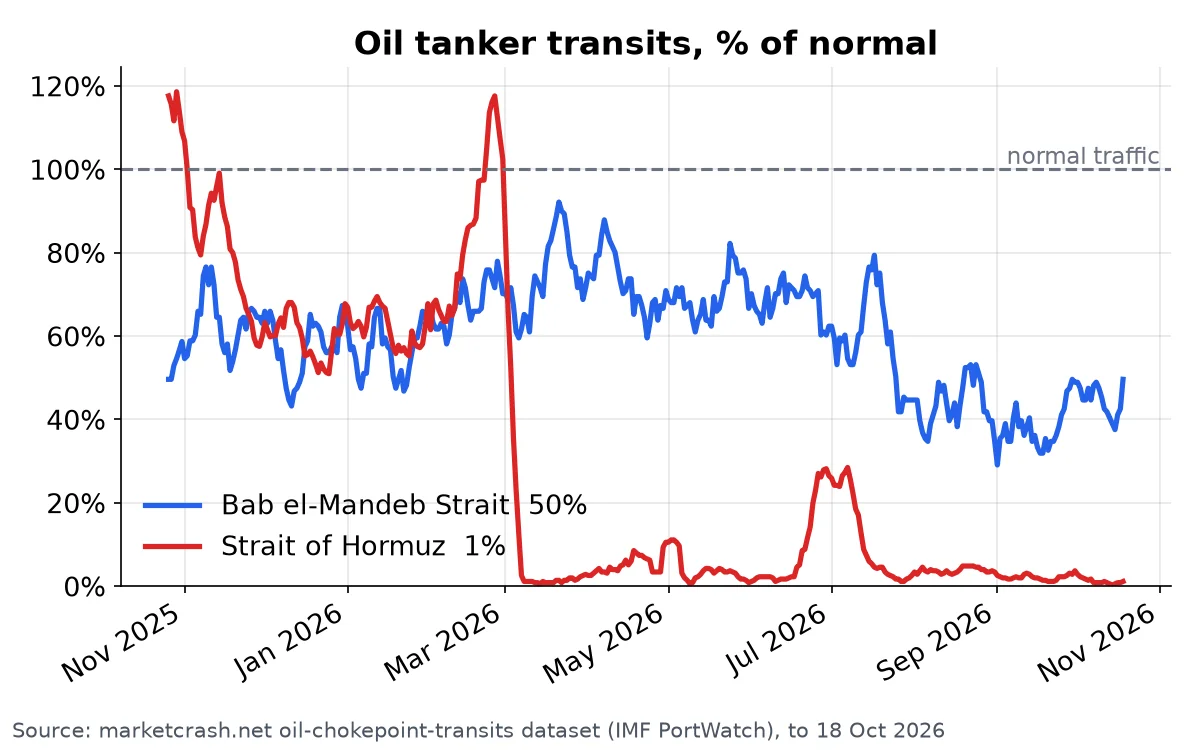
Valuation tells you how far stocks could fall. It rarely tells you what will start the fall. MarketCrash has an Events section for shocks from outside the US economy, read from live charts. Today it lists Oil Shock, Treasury Dump and Debt Spiral as CRITICAL, Private Credit as ELEVATED and AI Debt as CONTAINED.
The oil-shock reading isn't a guess. It comes from real ship traffic: tanker transits through the Strait of Hormuz and Bab el-Mandeb, tracked with IMF PortWatch satellite data.
We didn't see risks like these on the US valuation page we looked at.
It tells you what changed
Most chart sites show you today's number and leave you to remember last week's. MarketCrash has a What changed panel on the home page. It lists which indicators moved, such as real interest rates, the yield curve and the dollar index, along with the previous reading and the date of the move. You see in seconds whether anything happened while you were away.
MarketCrash also keeps shipping. A daily market watch now publishes alarm posts by itself, like the note when the Nasdaq fell 2.6% on Oct 22. The weekly recap for the week of Oct 26 covered the Fear and Greed Index at 21.6, which is Extreme Fear.
Head to head
- The question it answers. GuruFocus: is the market expensive by market cap to GNP (source)? MarketCrash: is crash risk high, and is growth holding up?
- Indicators. GuruFocus: the Buffett Indicator, a modified version of it, and pages for other countries (source). MarketCrash: the Buffett Indicator, Shiller PE, yield curve, unemployment, inflation and more, rolled up into a crash-risk score and a growth score.
- Outside shocks. MarketCrash: live statuses for Oil Shock, Treasury Dump, Debt Spiral, Private Credit and AI Debt.
- What changed. MarketCrash: shown right on the home page.
- Fresh commentary. MarketCrash: daily alarm posts and weekly recaps on the blog.
- Developers. MarketCrash: REST API endpoints for each indicator.
- Business model. GuruFocus: a research platform with paid plans.
Who should pick which
Pick GuruFocus if you research single companies the value-investing way, or if you want to compare valuations across countries.
Pick MarketCrash if you hold US stocks and want one honest answer to "is a crash building?" You get valuation, the yield curve, growth and outside shocks in one place, plus a clear view of what moved. With several outside shocks marked critical and fear running high, this is a bad time to watch only one gauge.
Don't wait for the headline
By the time a crash makes the news, the warning signs were already on the charts. Open the live dashboard, check today's crash-risk score, and sign up for email alerts. You'll get at most a weekly email, sent only in weeks when the crash-risk score or a big indicator actually moved, so you hear about the next turn while you can still act on it.
👉 See today's crash risk on MarketCrash
MarketCrash data is for educational and informational purposes only. It is not investment advice.