MarketCrash Weekly Recap: Valuations and Yields Ease, Scores Stay at 67%
The week in brief
Three of our headline indicators fell over the week to 16 October. Market valuation came down a little from extreme levels, the Treasury yield curve flattened, and real interest rates eased. Neither composite score changed: crash risk and growth both read 67% on 19 October. Oil tanker traffic through the two Middle East chokepoints is still far below normal.
Biggest moves
Buffett Indicator: 236.2% → 231.1%. The Buffett Indicator compares total US stock market value with GDP. It fell about 5 points in the week to 16 October, including a 3-point drop on the last day. Even after that fall, the page puts the reading at the 99.3rd percentile of months since 1995. That is well above its 150% negative threshold, and above the 146% level the page cites from before the 2000 dot-com crash.
Yield Curve: 0.44 → 0.35 percentage points. The 10Y–2Y Treasury spread narrowed by 0.09 points over the week. It is still positive, and above the site's 0.2 warning level. The page calls a spread between 0 and 0.5 a flat curve, which it treats as a slowdown sign. The current reading sits at the 31.6th percentile of months since 1976.
Real Interest Rates: 2.87% → 2.78%. The 10-year TIPS yield fell 0.09 points in the week to 15 October. It is still up 0.47 points over three months and sits at the 98.6th percentile of months since 2003.
Oil chokepoints
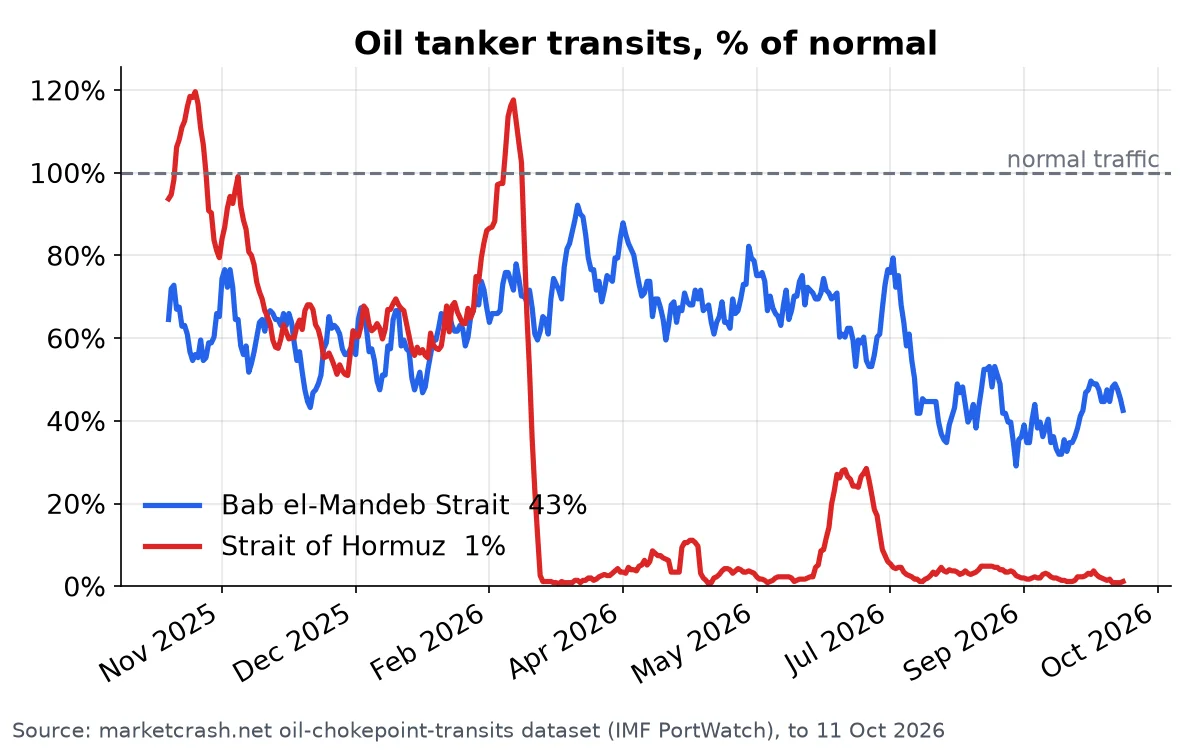
The Strait of Hormuz averaged about 0.6 tankers a day in the week to 11 October, against a pre-disruption baseline of 50.2. That is roughly 1% of normal. The page still labels this a severe disruption, as it has since the strait closed in March 2026. The Bab el-Mandeb averaged 8.6 tankers a day, about 43% of its 20.1 baseline, down 0.57 from the previous reading.
Crash-risk and growth scores
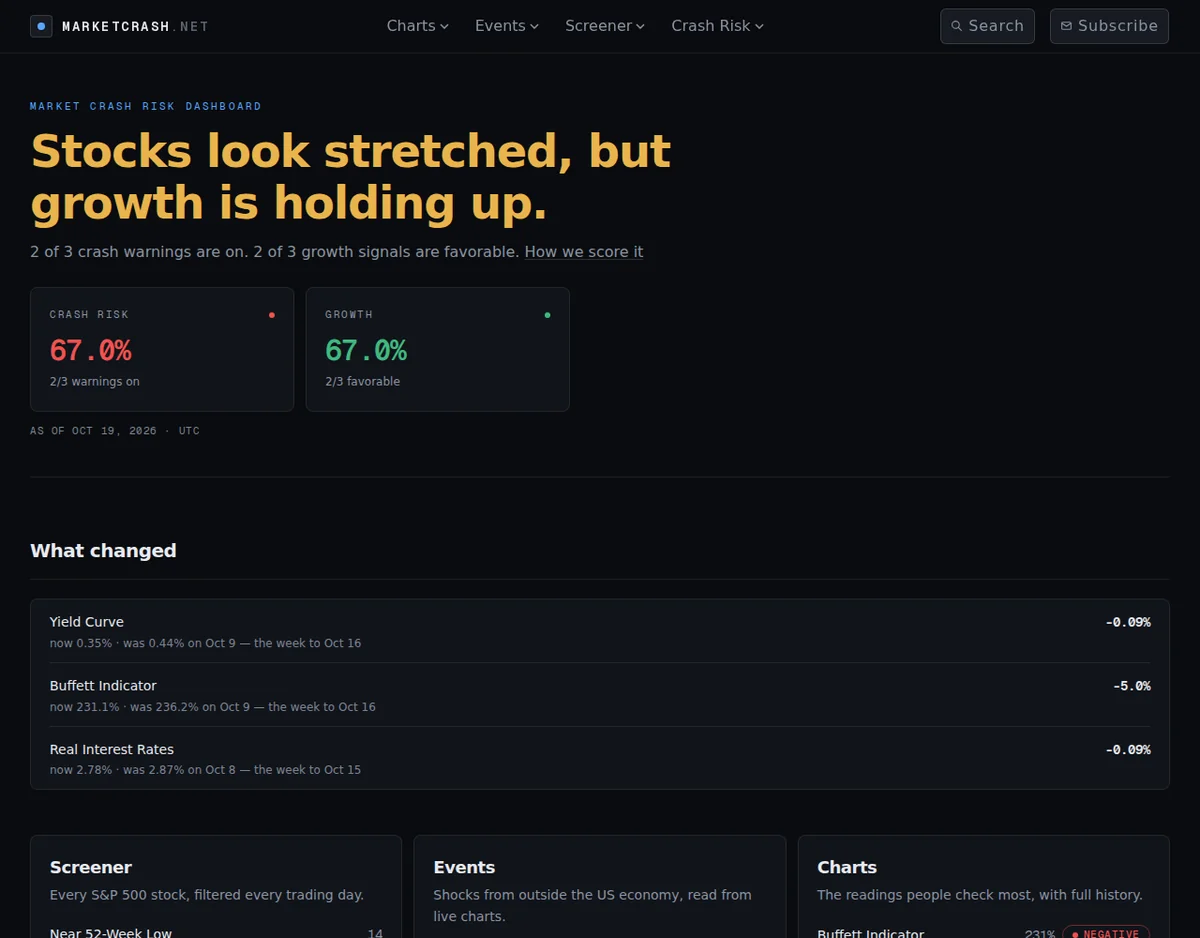
Crash risk: 67%, with 2 of 3 warnings on. Two valuation measures are negative: the Buffett Indicator at 231%, and the Shiller PE Ratio at 41. The Shiller PE is above its threshold of 35 and at the 98.8th percentile of monthly readings since 1871. The yield curve is the one signal still positive. This week's moves were too small to change any signal, so the score is unchanged.
Growth: 67%, with 2 of 3 signals favorable. M2 money supply is $23.3T in the latest data, for August 2026. That is up 1.43% over three months, which the site rates positive. Real interest rates are also rated positive. The US Dollar Index is the one warning: it is 101.85, up 0.66% over three months, which puts it in the 100–110 band the page describes as a strong dollar.
Data notes
The data changelog has no new entries this week. The latest entries are from 25 July 2026, when the real-rate series and the Buffett Indicator were corrected. The methodology page gives the formulas and source series for each indicator. Release dates vary by source, so readings shown here range from 1 August (M2) to 19 October (dollar index).
This recap describes data only. It is not investment advice.
See every score and indicator, updated daily, on the MarketCrash dashboard.